Sturdy NumbersSturdy Numbers
SAMPLEGauges

Gray Heron Heating & Air

HVAC · 6 trucks · Baton Rouge, LA · sample company

Books reconciled through September 30, 2026Bank balance as of Oct 12 at 6:02amAccrual basisSeptember books closed Oct 9two questions are waiting on your answer

Your four questions and the hire test

Read top to bottom: cash now, cash ahead, which work pays, who owes you, then whether you can add a tech.

Monthly report

Cash you can spend today

What's yours to spend once you set aside what you already owe.

On track
$167,152

$22,983 over your $144,170 floor

In the bank (your books)$212,400
Received, not yet deposited$6,982
Customer deposits you’re holding− $4,155
Card balance due− $30,001
Sales tax owed− $1,283
Next payroll, Oct 16− $16,790
Cash you can spend$167,152

Uncleared items: $22,385 in checks your bank hasn't paid yet. Your bank shows $234,784.

You can spend $167,152 today, $22,983 over your $144,170 floor. That's after setting aside the card balance and October 16's payroll.

See the numbers as a table
PieceAmount
In the bank (your books)$212,400
Received, not yet deposited$6,982
Customer deposits you’re holding−$4,155
Card balance due−$30,001
Sales tax owed−$1,283
Next payroll, Oct 16−$16,790
Cash you can spend$167,152

Cash in the bank, next 13 weeks

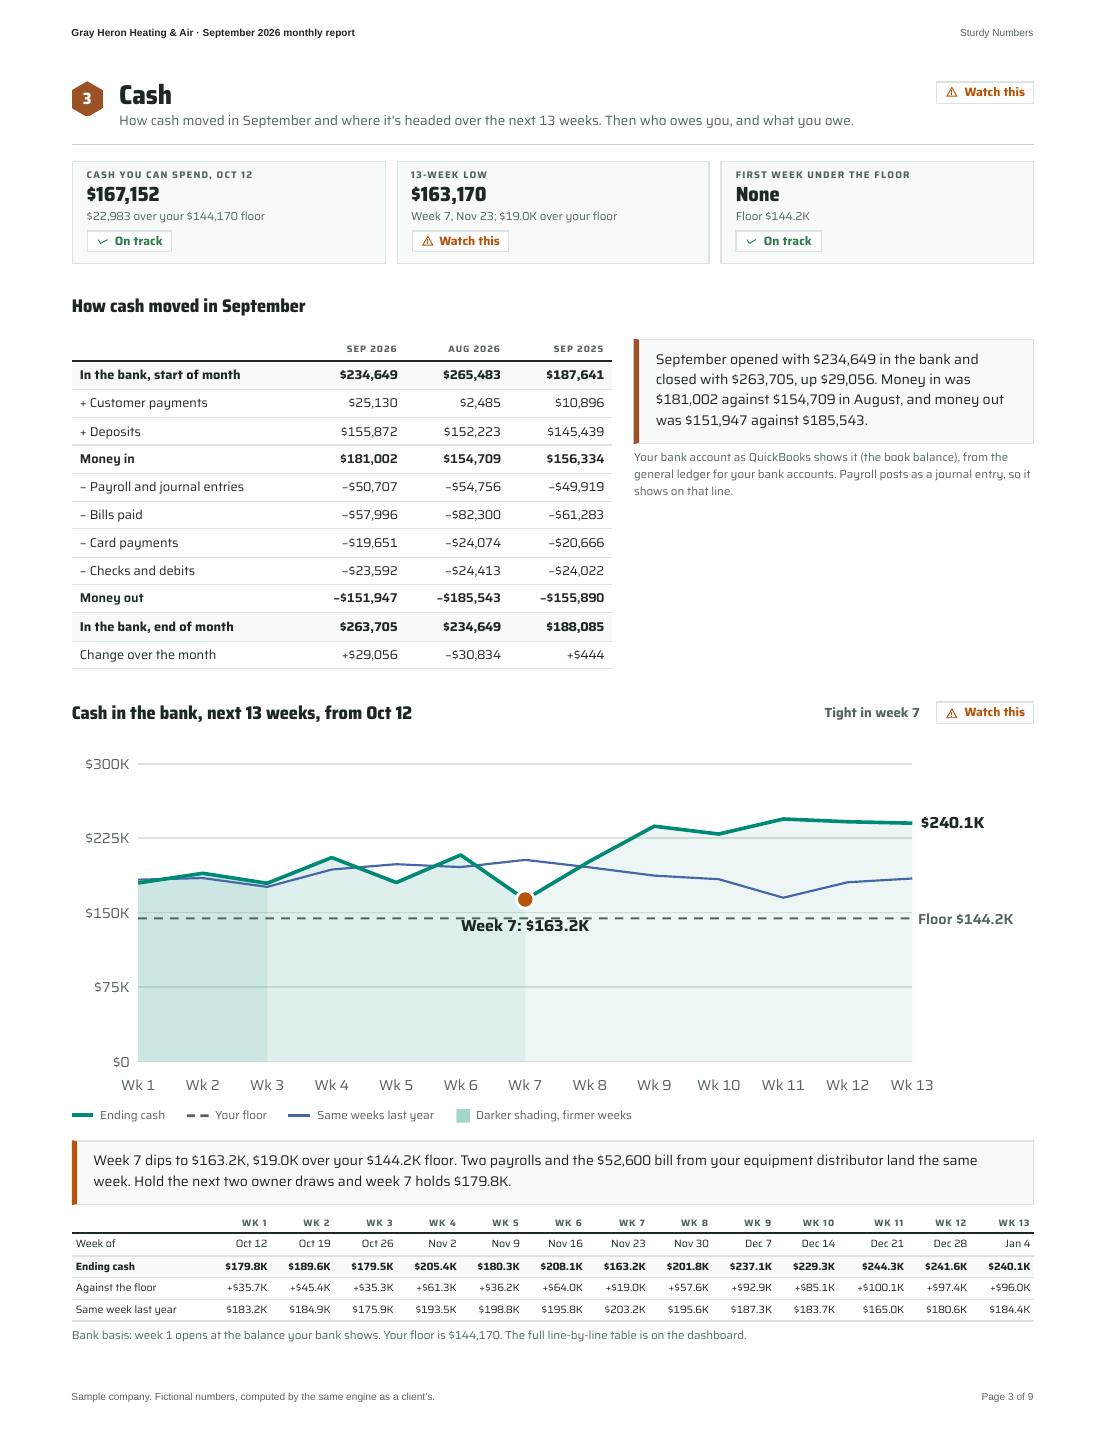
Where cash is headed, week by week. Tight weeks show up here before they show up at payroll.

Watch this
13-week low
$163.2K
Week 7, Nov 23
First week under the floor
None
Floor $144.2K
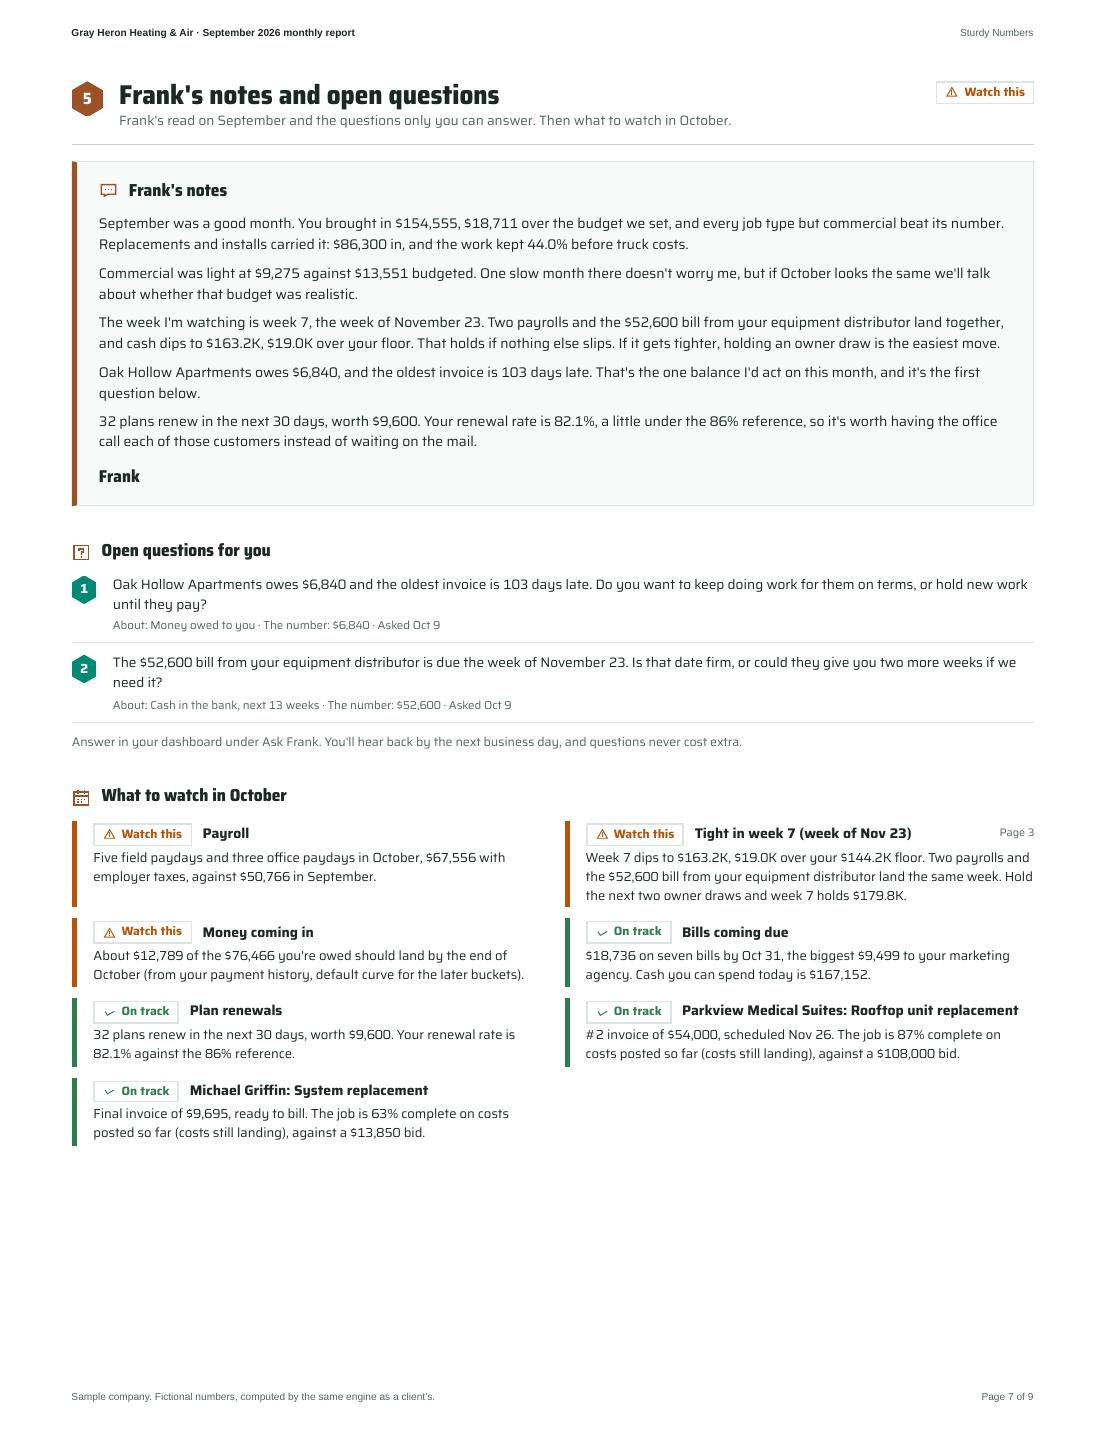
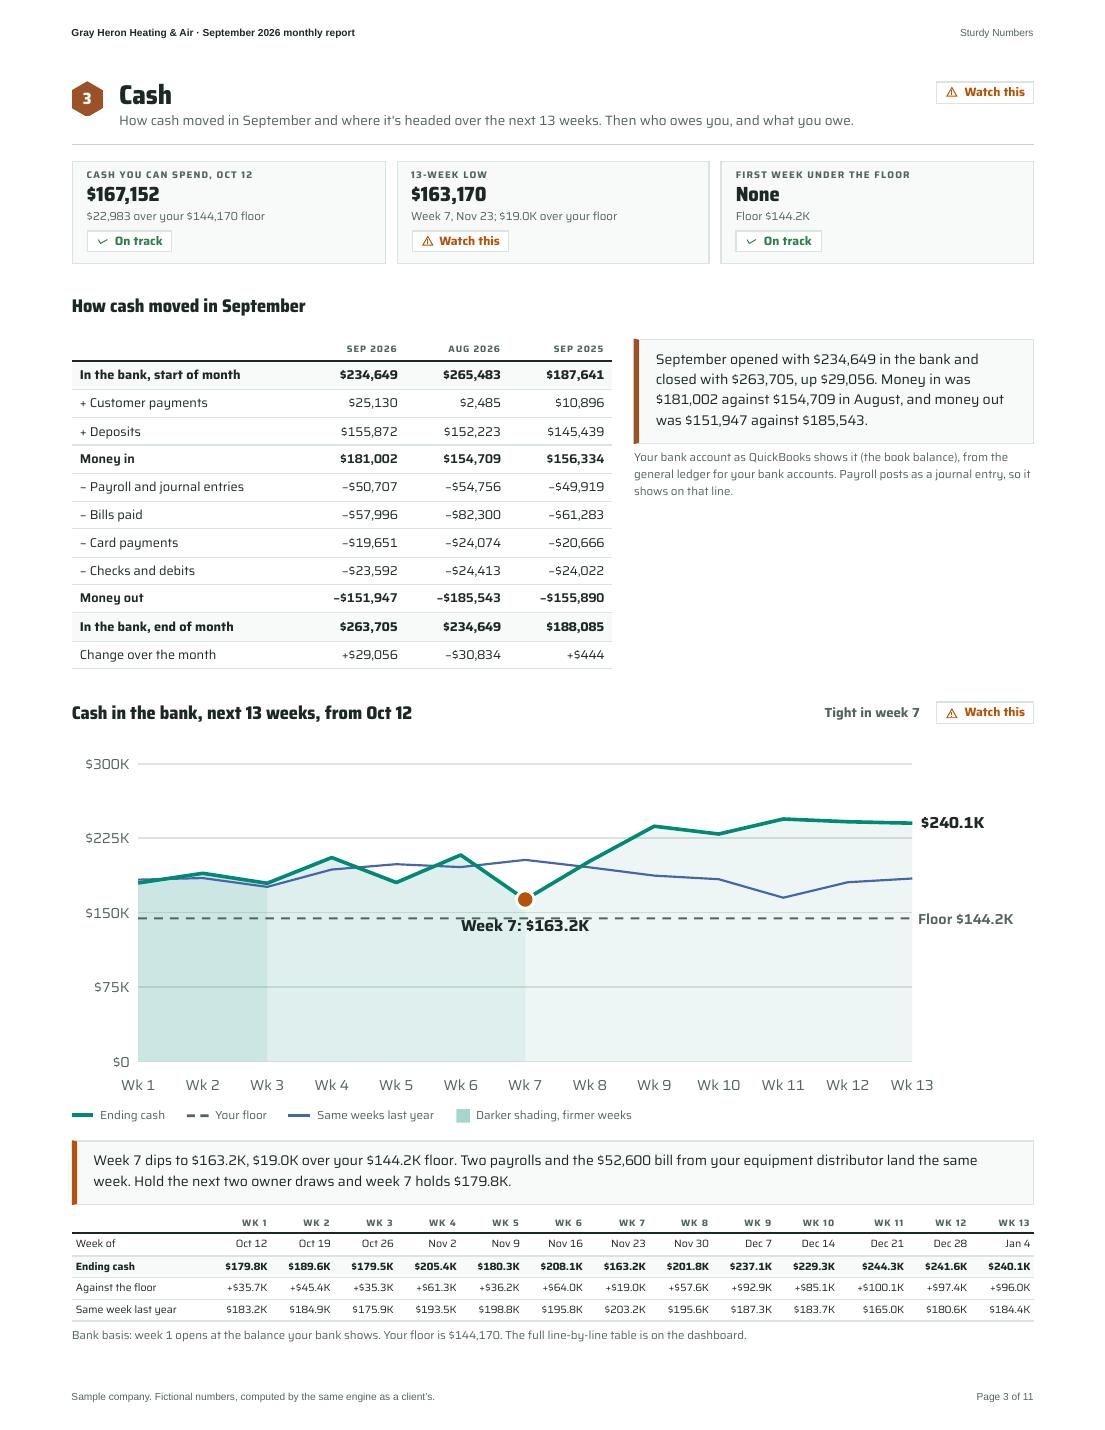
Week 7 dips to $163.2K, $19.0K over your $144.2K floor. Two payrolls and the $52,600 bill from your equipment distributor land the same week. Hold the next two owner draws and week 7 holds $179.8K. $0$75K$150K$225K$300K Floor $144.2K $240.1K Week 7: $163.2K Wk 1Wk 2Wk 3Wk 4Wk 5Wk 6Wk 7Wk 8Wk 9Wk 10Wk 11Wk 12Wk 13
Ending cashYour floorSame weeks last yearDarker shading, firmer weeks

Week 7 dips to $163.2K, $19.0K over your $144.2K floor. Two payrolls and the $52,600 bill from your equipment distributor land the same week. Hold the next two owner draws and week 7 holds $179.8K.

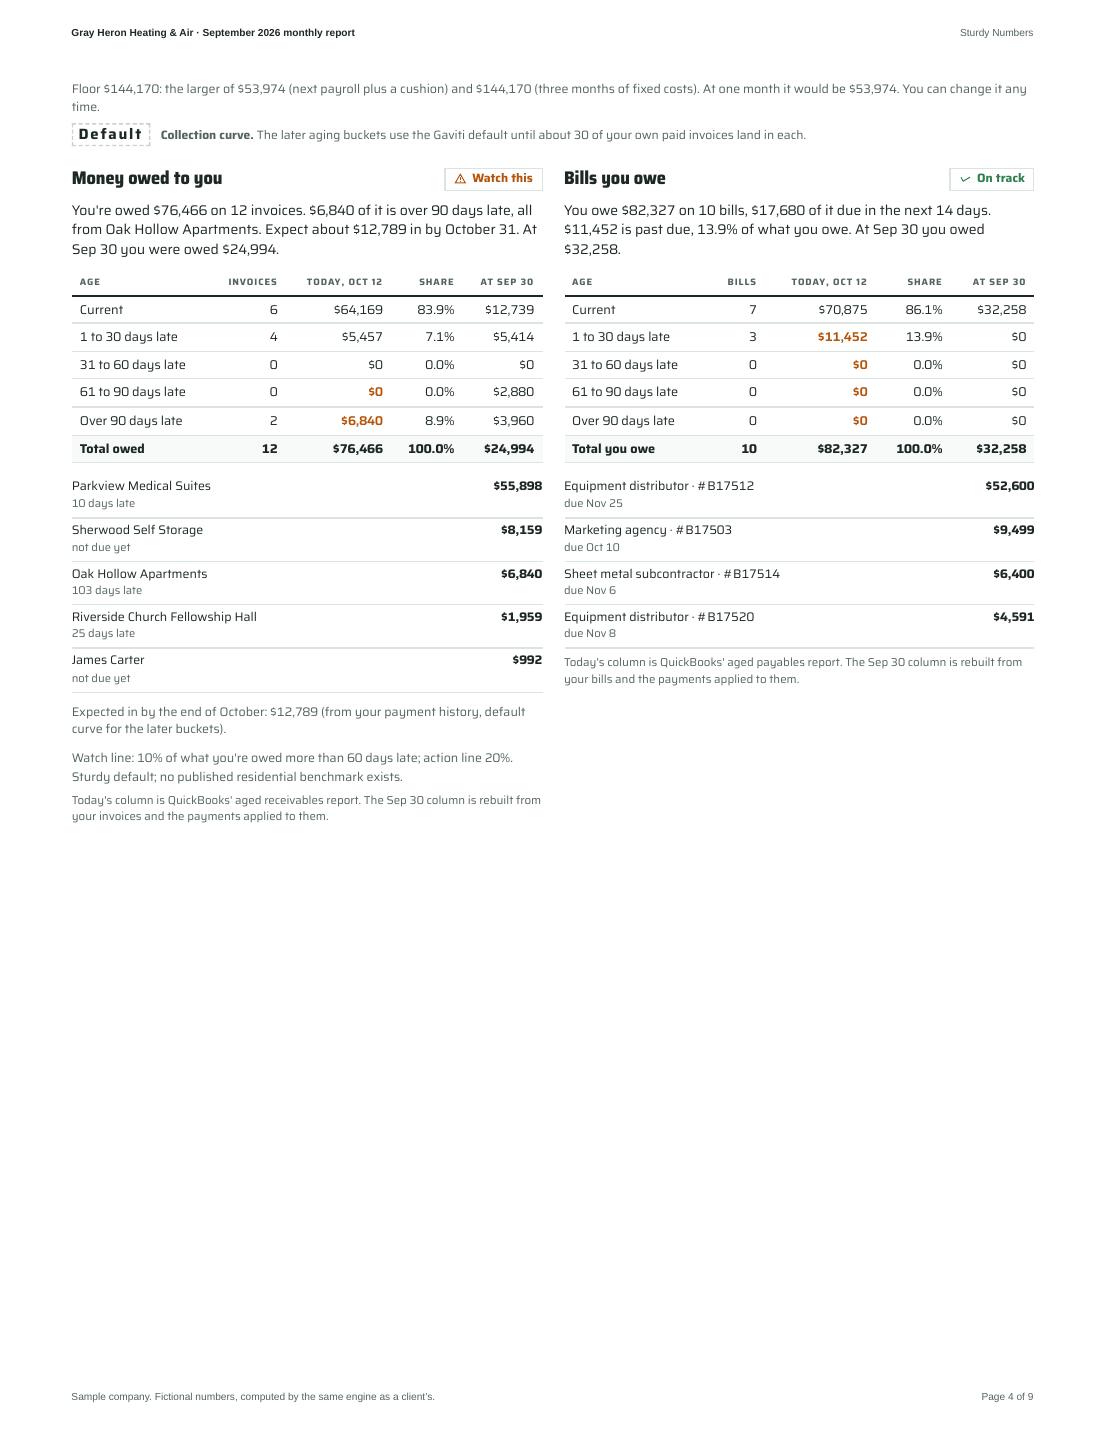
Floor $144,170: the larger of $53,974 (next payroll plus a cushion) and $144,170 (three months of fixed costs). At one month it would be $53,974. You can change it any time.

At four weeks out, the ending-cash forecast has landed within $39.5K 80% of the time, over 26 weekly cycles.

±$20Kwk 1
±$24Kwk 2
±$34Kwk 3
±$40Kwk 4
±$41Kwk 5
±$48Kwk 6
±$53Kwk 7
±$64Kwk 8
±$63Kwk 9
±$71Kwk 10
±$71Kwk 11
±$76Kwk 12
±$68Kwk 13

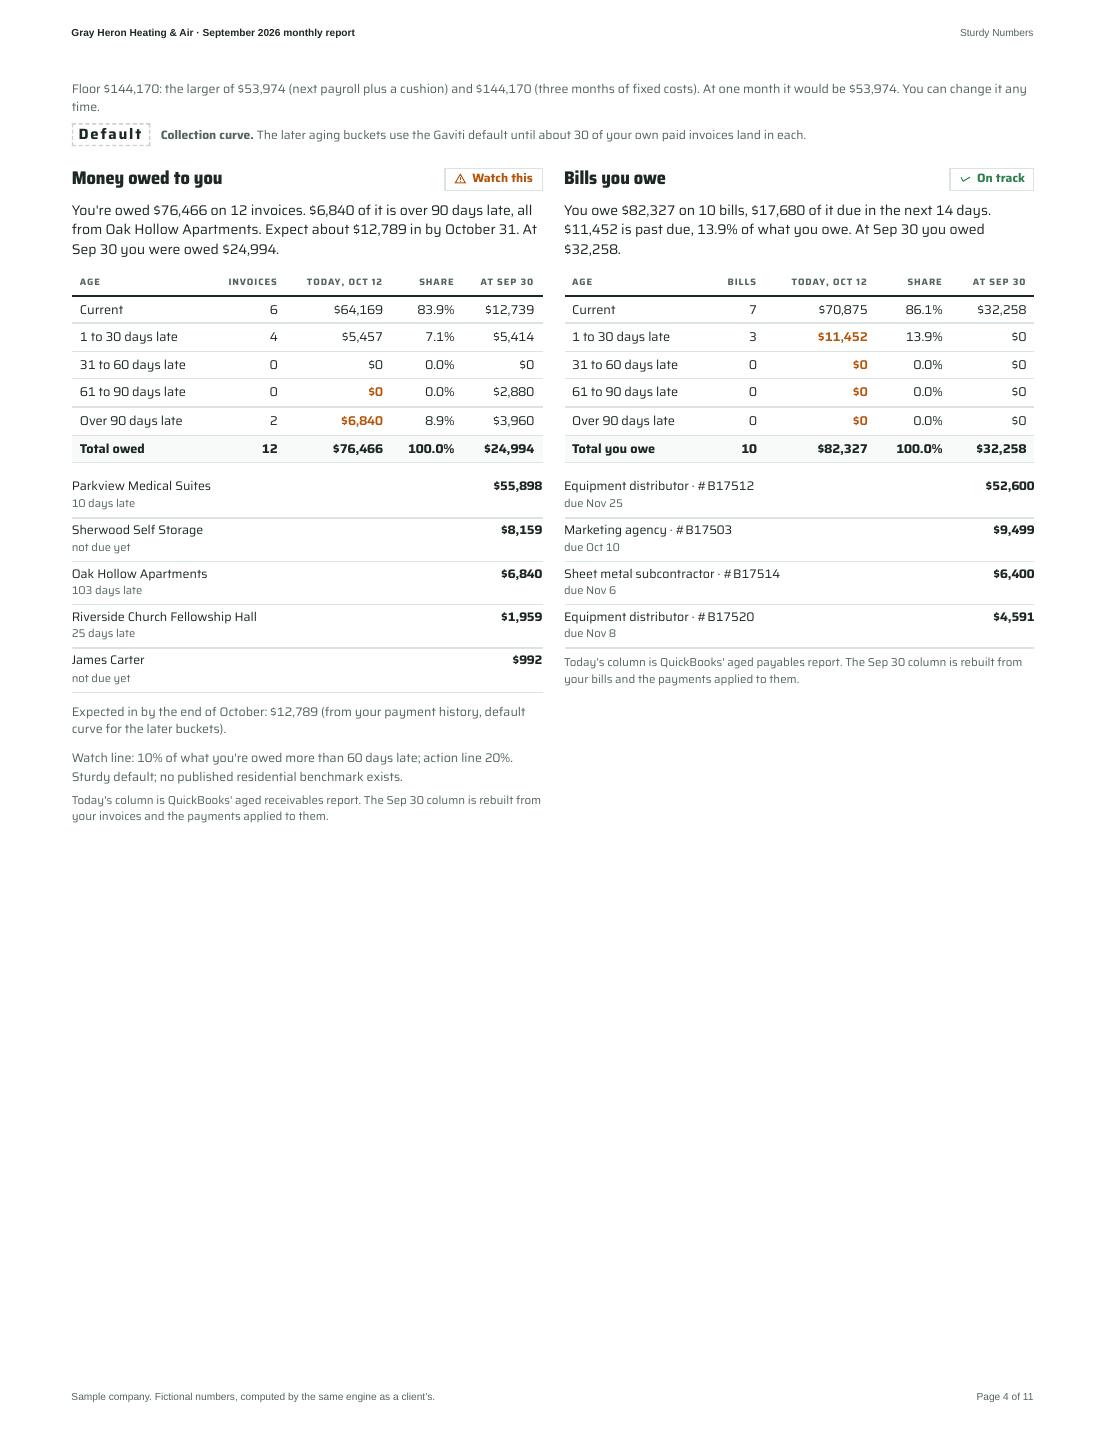
DefaultCollection curve. The later aging buckets use the Gaviti default until about 30 of your own paid invoices land in each.

Shading darkens with confidence: weeks 1 and 2 come from scheduled items, 3 to 6 from approved bills and booked work, 7 to 13 from your seasonal pattern.

See the numbers as a table
Bank basis: week 1 opens at the balance your bank shows; checks not yet cleared come out in week 1.
LineWk 1Wk 2Wk 3Wk 4Wk 5Wk 6Wk 7Wk 8Wk 9Wk 10Wk 11Wk 12Wk 13
Week startingOct 12Oct 19Oct 26Nov 2Nov 9Nov 16Nov 23Nov 30Dec 7Dec 14Dec 21Dec 28Jan 4
Opening cash (bank)$234,784$179,839$189,619$179,499$205,424$180,343$208,125$163,170$201,807$237,095$229,262$244,314$241,606
+ Deposits on the way and received, not deposited$6,982$0$0$0$0$0$0$0$0$0$0$0$0
+ Collections on money owed to you$2,598$5,407$5,580$2,142$103$103$13,603$27,103$13,603$103$103$103$103
+ Booked work (from your job software)$3,598$1,741$696$540$0$0$0$0$54,000$0$0$0$0
+ Maintenance plan renewals$2,520$1,512$1,764$2,268$1,260$2,520$3,024$3,528$2,772$3,276$3,024$2,772$1,764
+ Financing company payouts$8,919$0$0$0$0$0$0$0$0$0$0$0$0
+ Work not booked yet (your last three years)$4,264$16,744$25,702$36,193$36,733$36,715$36,711$36,619$0$36,622$36,726$36,862$37,405
− Payroll with employer taxes$16,790$8,593$16,790$8,593$16,790$8,593$16,790$8,593$16,790$8,593$16,790$8,593$16,790
− Checks written, not cleared yet$22,385$0$0$0$0$0$0$0$0$0$0$0$0
− Owner draws (your call)$0$0$17,000$0$0$0$17,000$0$0$0$0$17,000$0
− Bills you owe, by due date$11,452$4,999$1,228$1,056$10,991$0$52,600$0$0$0$0$0$0
− Rent, insurance and other fixed costs$3,199$750$8,843$3,000$13,599$750$0$11,843$10,400$3,949$0$8,843$13,400
− Truck and equipment loans$0$0$0$2,570$0$0$0$2,570$0$0$0$0$2,570
− Credit card payment$30,001$0$0$0$21,796$0$0$0$0$21,796$0$0$0
− Sales tax$0$1,283$0$0$0$1,283$0$0$0$1,283$0$0$0
− Insurance, true-ups and estimates$0$0$0$0$0$0$8,250$0$0$4,200$0$0$0
− Parts for work not booked yet$0$0$0$0$0$930$3,653$5,607$7,896$8,014$8,010$8,009$7,989
Ending cash$179,839$189,619$179,499$205,424$180,343$208,125$163,170$201,807$237,095$229,262$244,314$241,606$240,129
Your floor$144,170$144,170$144,170$144,170$144,170$144,170$144,170$144,170$144,170$144,170$144,170$144,170$144,170
Same week last year$183,156$184,854$175,852$193,454$198,752$195,835$203,224$195,643$187,332$183,654$164,960$180,630$184,394
Customer deposits held (in the totals above)$4,155$4,155$4,155$4,155$4,155$4,155$4,155$4,155$4,155$4,155$4,155$4,155$4,155

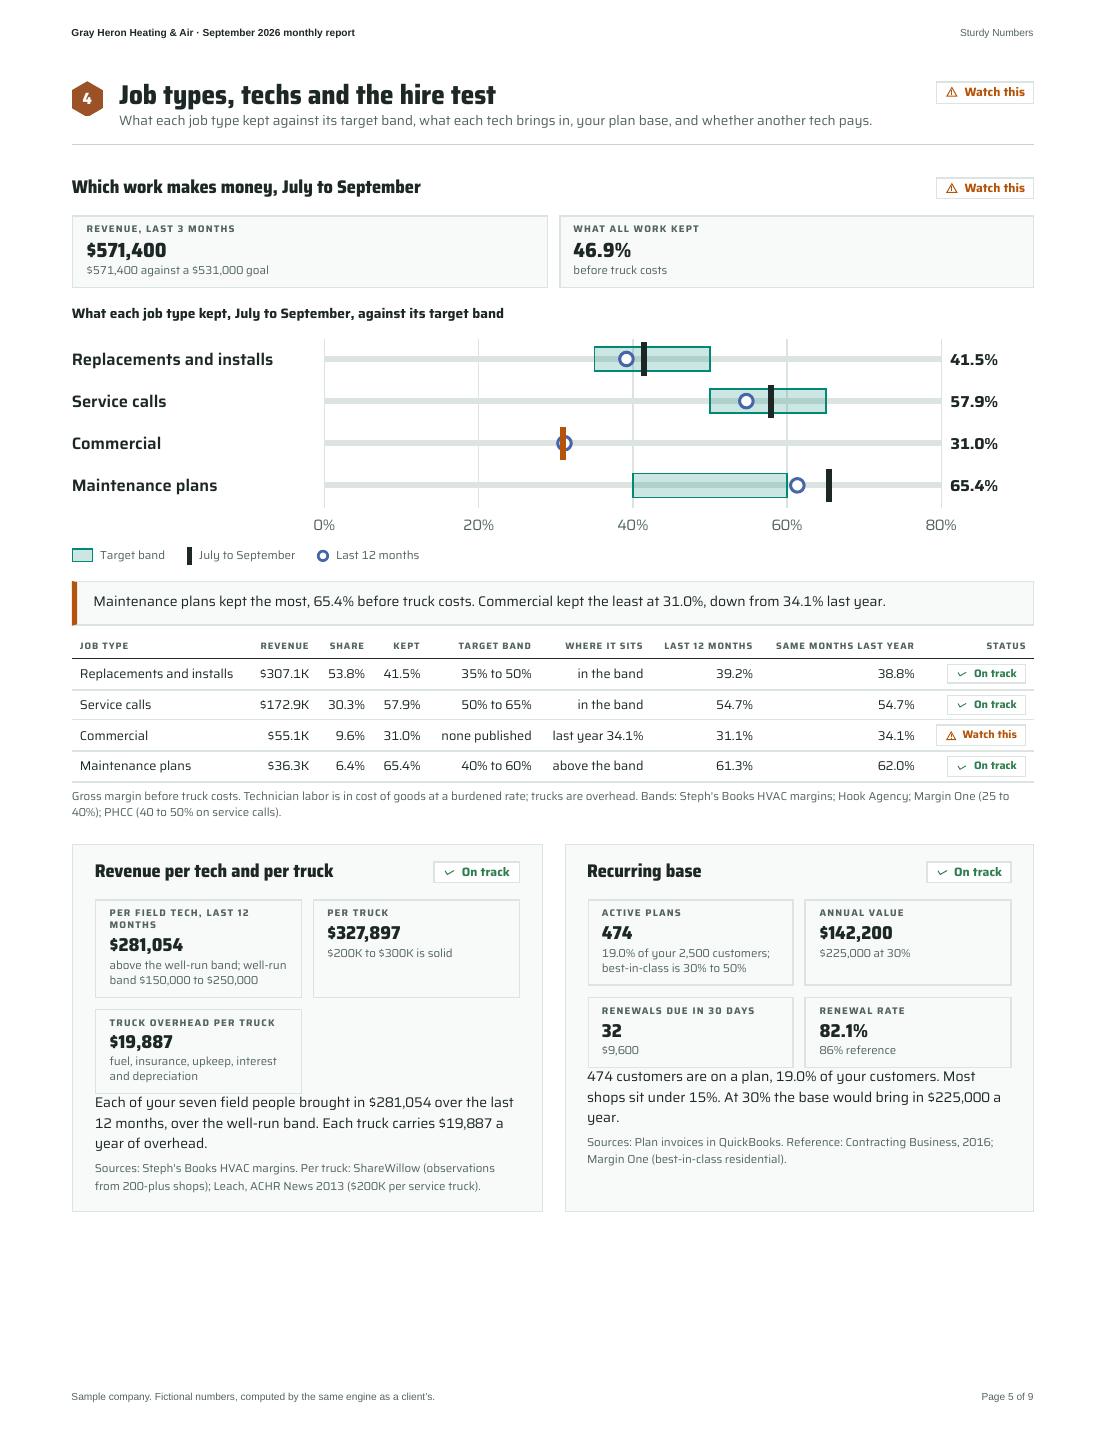
Which work makes money

Revenue and what each type of job kept, before truck costs.

Watch this
Revenue, last 3 months
$571.4K
$571,400 against a $531,000 goal
What all work kept
46.9%
before truck costs
Replacements and installs$307.1K · 41.5%
53.8% of revenuekept 41.5%
Band: 35% to 50%in the band
Service calls$172.9K · 57.9%
30.3% of revenuekept 57.9%
Band: 50% to 65%in the band
Commercial$55.1K · 31.0%
9.6% of revenuekept 31.0%
Band: no published bandlast year 34.1%
Maintenance plans$36.3K · 65.4%
6.4% of revenuekept 65.4%
Band: 40% to 60%above the band

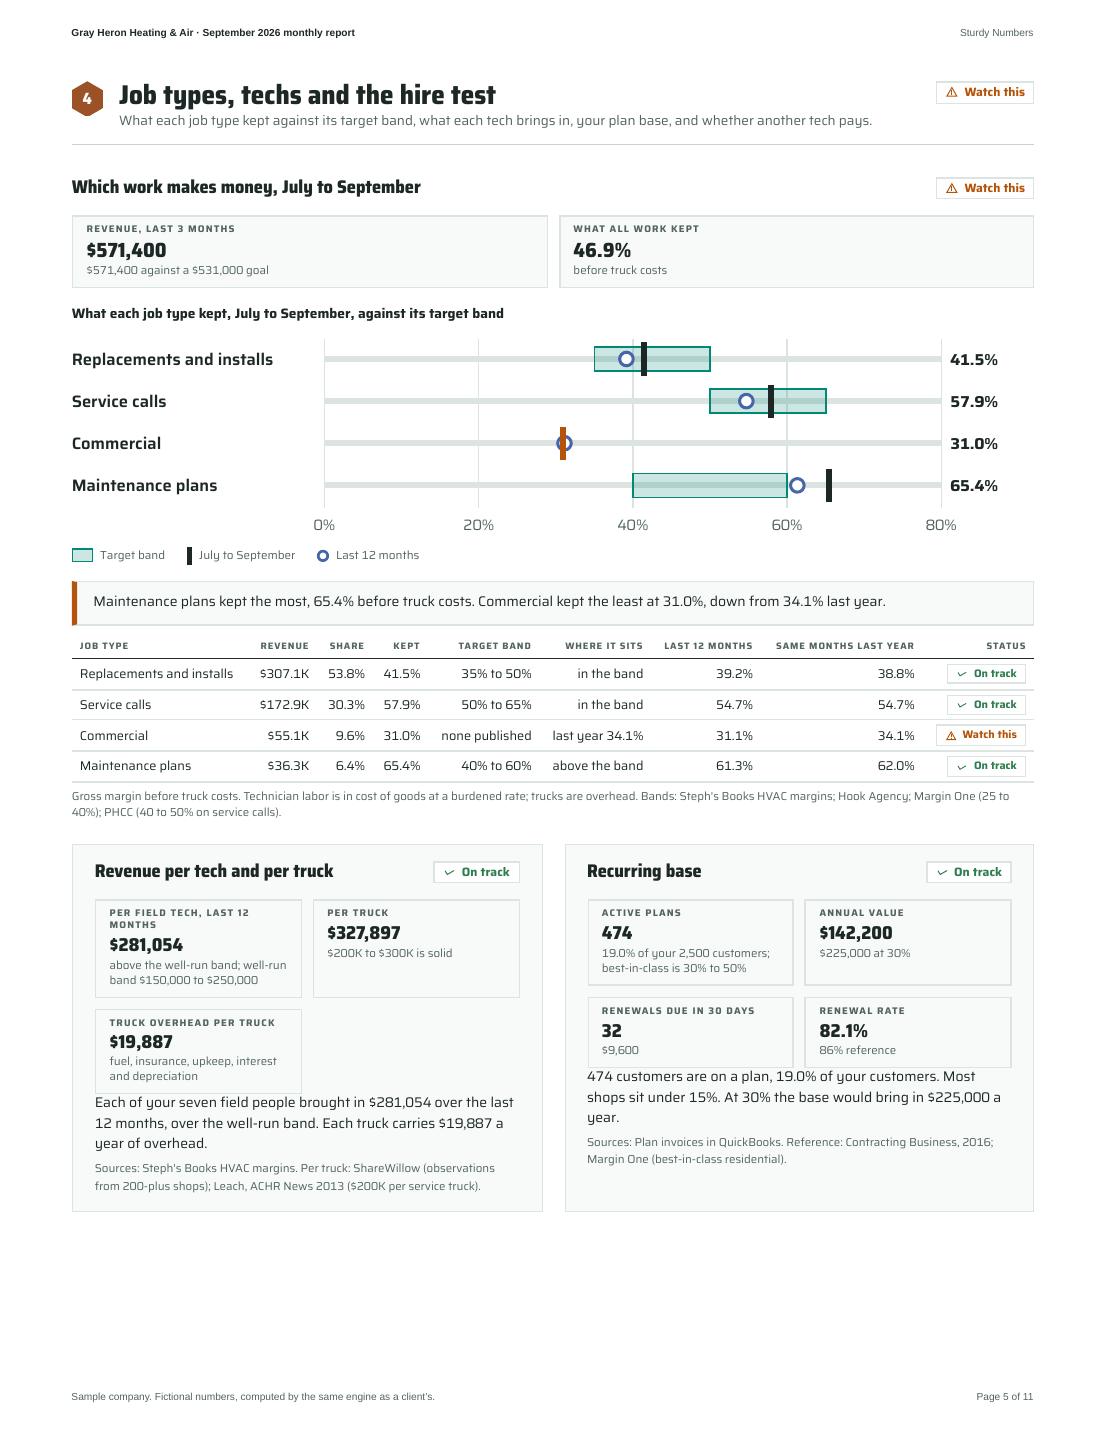
Maintenance plans kept the most, 65.4% before truck costs. Commercial kept the least at 31.0%, down from 34.1% last year.

See the numbers as a table
Gross margin before truck costs. Technician labor is in cost of goods at a burdened rate; trucks are overhead. Bands: Steph's Books HVAC margins; Hook Agency; Margin One (25 to 40%); PHCC (40 to 50% on service calls).
Job typeRevenueShareCost of goodsGross profitMarginTarget bandLast year margin
Replacements and installs$307,15053.8%$179,760$127,39041.5%35% to 50%38.8%
Service calls$172,88430.3%$72,862$100,02257.9%50% to 65%54.7%
Commercial$55,0669.6%$38,002$17,06431.0%none published34.1%
Maintenance plans$36,3006.4%$12,543$23,75765.4%40% to 60%62.0%
All job types$571,400100.0%$303,166$268,23446.9%

July to September, closed months. Bars show revenue; the thin line under each shows what it kept, with the target band shaded.

Revenue, last 12 months
$1.97M
$1,967,381 against a $2,124,000 goal
What all work kept
44.6%
before truck costs
Replacements and installs$1.05M · 39.2%
53.5% of revenuekept 39.2%
Band: 35% to 50%in the band
Service calls$586.4K · 54.7%
29.8% of revenuekept 54.7%
Band: 50% to 65%in the band
Commercial$188.2K · 31.1%
9.6% of revenuekept 31.1%
Band: no published bandno published band
Maintenance plans$140.5K · 61.3%
7.1% of revenuekept 61.3%
Band: 40% to 60%above the band

Maintenance plans kept the most, 61.3% before truck costs. Commercial kept the least at 31.1%.

See the numbers as a table
Gross margin before truck costs. Technician labor is in cost of goods at a burdened rate; trucks are overhead. Bands: Steph's Books HVAC margins; Hook Agency; Margin One (25 to 40%); PHCC (40 to 50% on service calls).
Job typeRevenueShareCost of goodsGross profitMarginTarget bandLast year margin
Replacements and installs$1,052,25053.5%$640,262$411,98839.2%35% to 50%n/a
Service calls$586,39629.8%$265,617$320,77954.7%50% to 65%n/a
Commercial$188,2359.6%$129,668$58,56731.1%none publishedn/a
Maintenance plans$140,5007.1%$54,345$86,15561.3%40% to 60%n/a
All job types$1,967,381100.0%$1,089,892$877,48944.6%

October to September, closed months. Bars show revenue; the thin line under each shows what it kept, with the target band shaded.

Money owed to you

Unpaid invoices, by how long they're late. Tap a customer to call.

Watch this
Total owed
$76,466
8.9% more than 60 days late
Expected in by the end of October
$12,789
from your payment history, default curve for the later buckets
Current$64,169
1 to 30 days late$5,457
31 to 60 days late$0
61 to 90 days late$0
Over 90 days late$6,840

Five biggest balances (sample phone numbers)

Parkview Medical Suites
10 days late
$55,898
Sherwood Self Storage
not due yet
$8,159
Oak Hollow Apartments
103 days late
$6,840
Riverside Church Fellowship Hall
25 days late
$1,959
James Carter
not due yet
$992

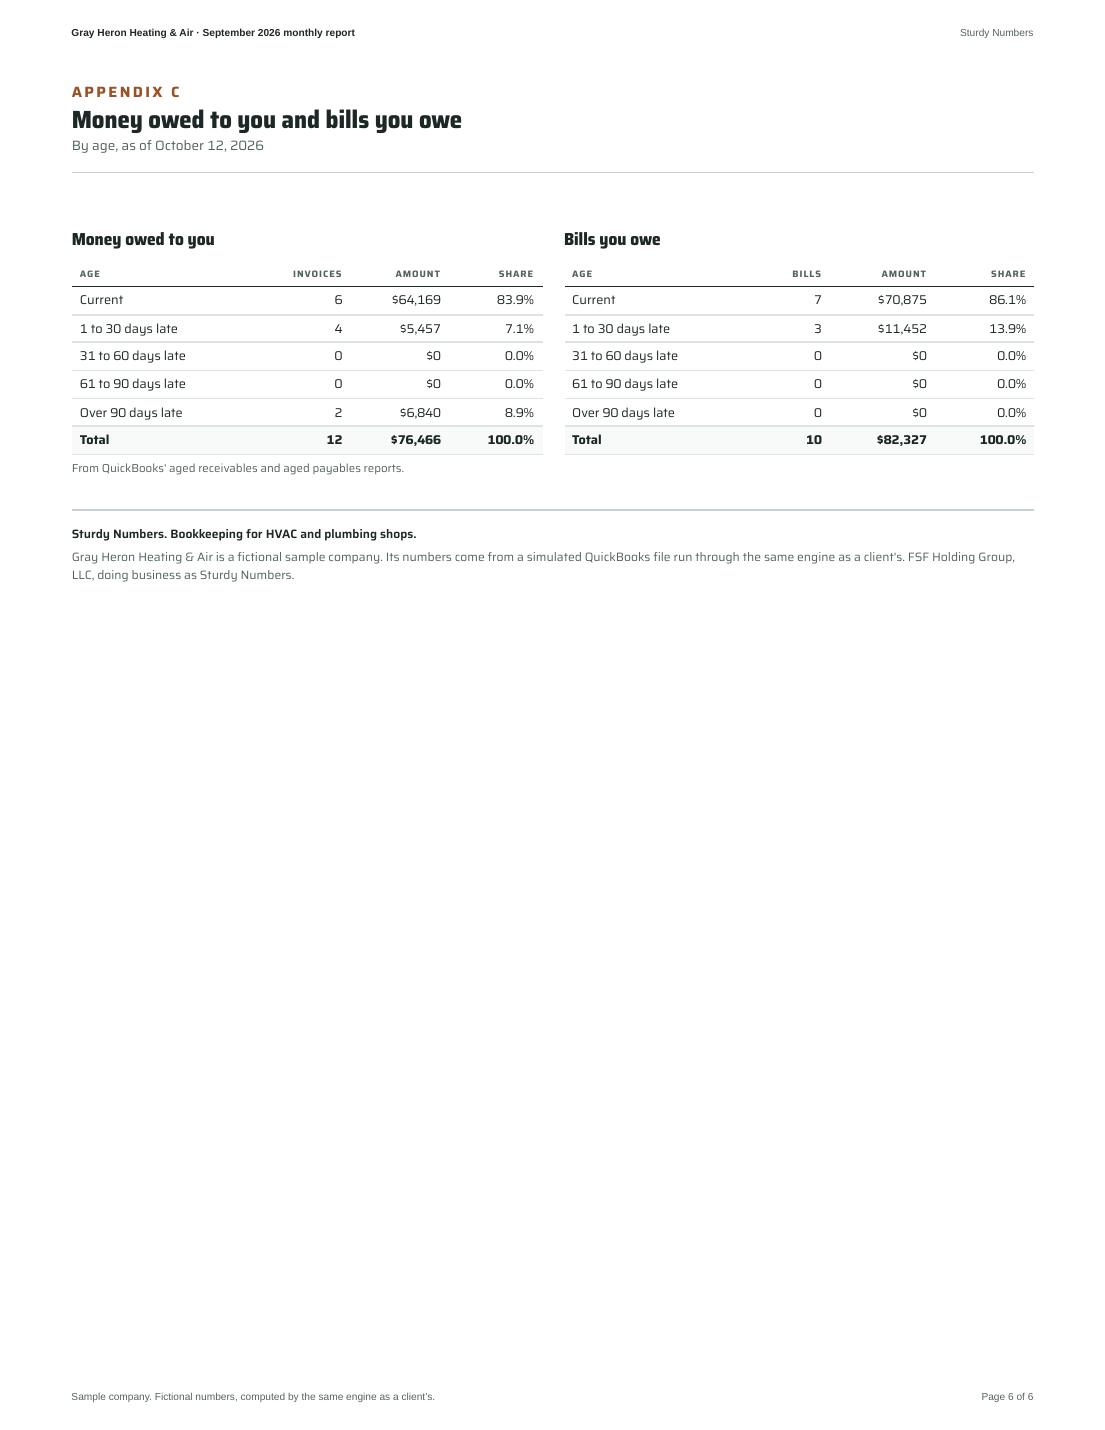
You're owed $76,466 on 12 invoices. $6,840 of it is over 90 days late, all from Oak Hollow Apartments. Expect about $12,789 in by October 31.

See the numbers as a table
AgeInvoicesAmountShare
Current6$64,16983.9%
1 to 30 days late4$5,4577.1%
31 to 60 days late0$00.0%
61 to 90 days late0$00.0%
Over 90 days late2$6,8408.9%
Total owed12$76,466100.0%

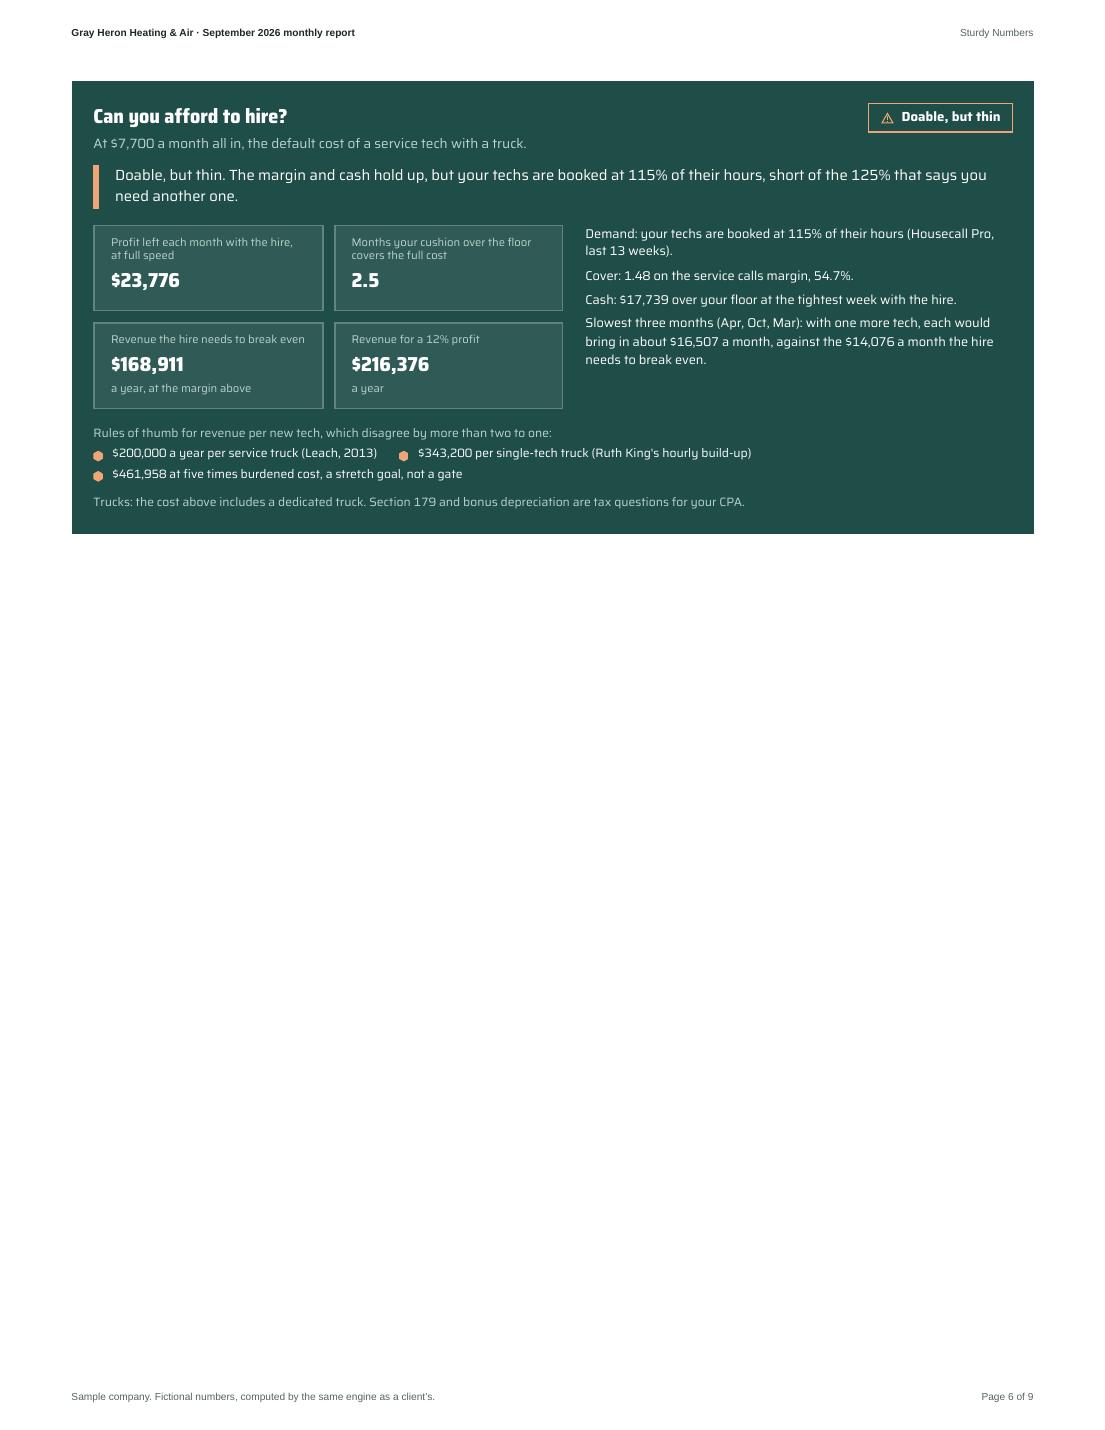
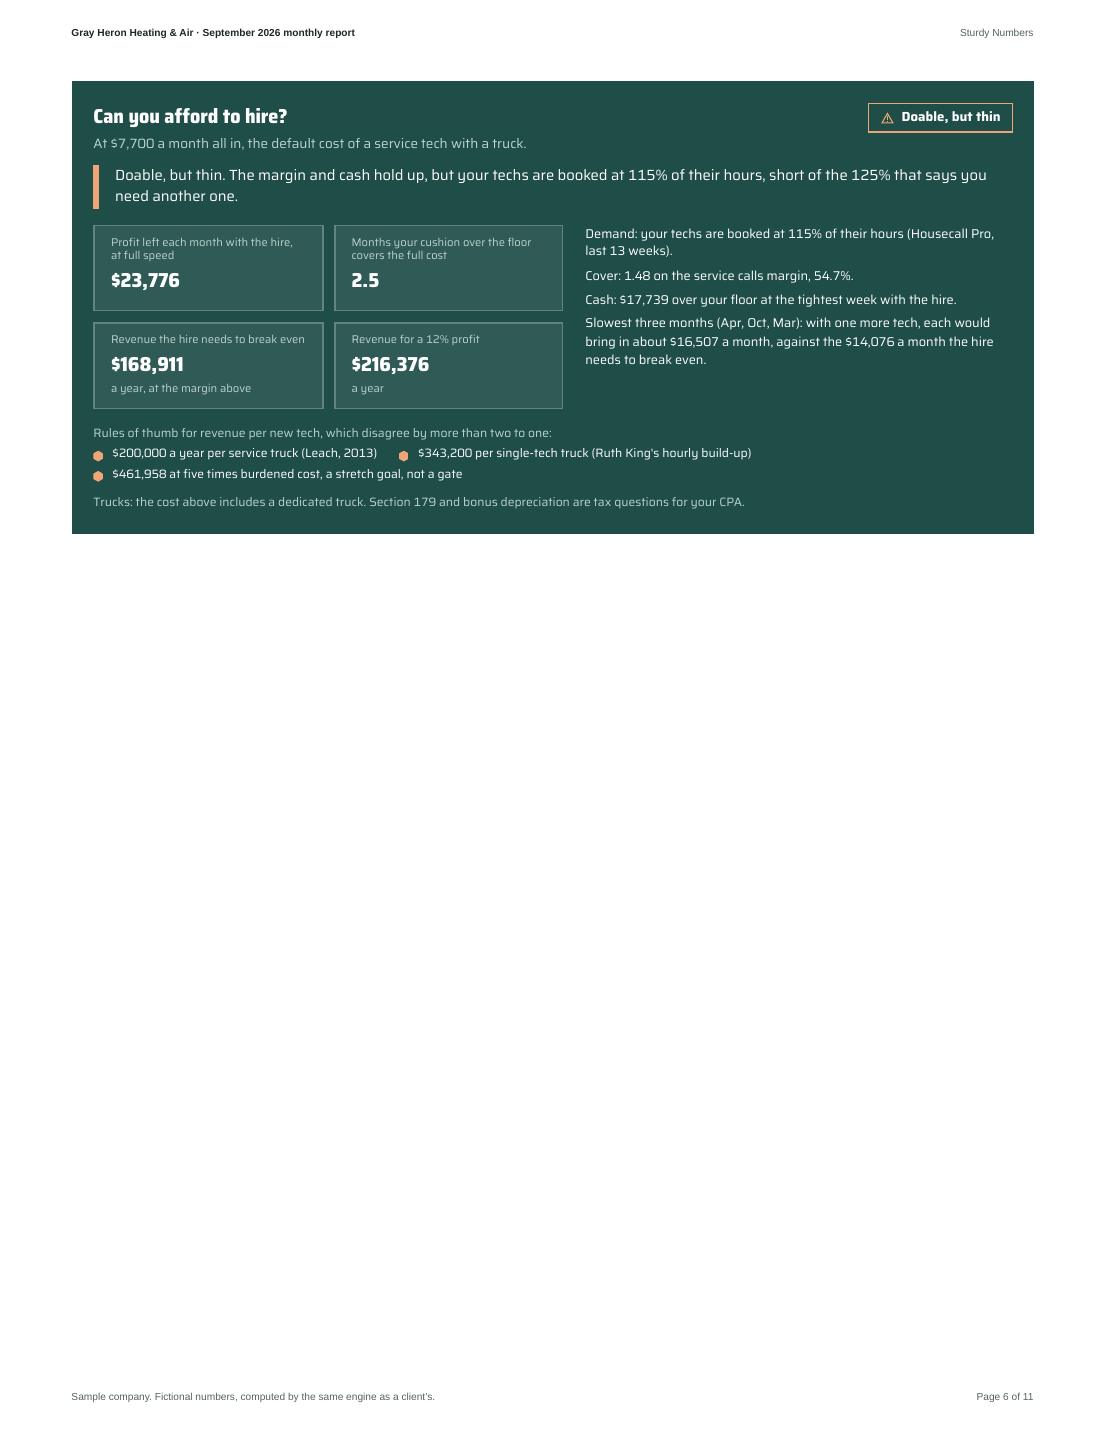
Can you afford to hire?

Set the all-in monthly cost: wage, payroll taxes, insurance, phone and the truck.

Doable, but thin
$7,700
Profit left each month with the hire, at full speed
$23,776
Months your cushion over the floor covers the full cost
2.5
Doable, but thin. The margin and cash hold up, but your techs are booked at 115% of their hours, short of the 125% that says you need another one.

Cash with and without the hire

Ending cash for 13 weeks. The dotted line carries the hire's cost while the new tech ramps up.

Cash for the next 13 weeks, without and with the hire $0$200K$400K Wk 1Wk 3Wk 5Wk 7Wk 9Wk 11Wk 13
Without the hireWith the hireYour floor

Demand: your techs are booked at 115% of their hours (Housecall Pro, last 13 weeks).

Cover: 1.48 on the service calls margin, 54.7%.

Cash: $17,739 over your floor at the tightest week with the hire.

Slowest three months (Apr, Oct, Mar): with one more tech, each would bring in about $16,507 a month, against the $14,076 a month the hire needs to break even.

See the numbers as a table
WeekWithout the hireWith the hireFloor
Wk 1$179,839$179,377$144,170
Wk 2$189,619$188,695$144,170
Wk 3$179,499$178,113$144,170
Wk 4$205,424$203,576$144,170
Wk 5$180,343$178,691$144,170
Wk 6$208,125$206,668$144,170
Wk 7$163,170$161,909$144,170
Wk 8$201,807$200,741$144,170
Wk 9$237,095$236,883$144,170
Wk 10$229,262$229,903$144,170
Wk 11$244,314$245,808$144,170
Wk 12$241,606$243,953$144,170
Wk 13$240,129$243,329$144,170

Revenue the hire must produce

To break even
$168,911
a year, at the margin above
At a 12% profit
$216,376
a year

Rules of thumb, which disagree by more than two to one:

  • $200,000 a year per service truck (Leach, 2013)
  • $343,200 per single-tech truck (Ruth King's hourly build-up)
  • $461,958 at five times burdened cost, a stretch goal, not a gate

Trucks: the cost above includes a dedicated truck. We plan the Section 179 and bonus depreciation timing with you. Your CPA files the return.

See the numbers as a table
Default costs from the Sturdy research, labeled defaults until your own numbers replace them.
CostA yearA month
Base pay$62,940$5,245
Social Security and Medicare$4,815$401
Federal unemployment$42$4
State unemployment$140$12
Workers' comp$2,455$205
Health insurance$5,400$450
Truck (lease, insurance, upkeep)$12,600$1,050
Software seat$3,000$250
Training$1,000$83
All in$92,392$7,699

The rest of the picture

The numbers behind the numbers, and anything Frank is working on.

Data quality
Books are clean through the last close. Every number ties to QuickBooks.
On track
  • Every September cost is assigned to a job type.On track
  • 2 open jobs are still collecting costs; labor posts at the monthly close.On track
  • Field payroll is split by job type through the last close.On track
  • Payments received but not yet deposited are shown apart from cash in the bank.On track
  • Book and bank agree through the last statement.On track
  • No late invoice has an unapplied payment sitting beside it.On track
  • Owner draws sit in equity, not expenses.On track
  • Your job software shows $156,395 for September, your books show $154,555. The difference is two invoices not yet exported.On track

Recurring base

On track
Active plans
474
19.0% of your 2,500 customers; best-in-class is 30% to 50%
Annual value
$142,200
$225,000 at 30%
Renewals due in 30 days
32
$9,600
Renewal rate
82.1%
86% reference

474 customers are on a plan, 19.0% of your customers. Most shops sit under 15%. At 30% the base would bring in $225,000 a year.

Sources: Plan invoices in QuickBooks. Reference: Contracting Business, 2016; Margin One (best-in-class residential).

Revenue per tech and per truck

On track
Per field tech, last 12 months
$281,054
above the well-run band; well-run band $150,000 to $250,000
Per truck
$327,897
$200K to $300K is solid
Truck overhead per truck
$19,887
fuel, insurance, upkeep, interest and depreciation

Each of your seven field people brought in $281,054 over the last 12 months, over the well-run band. Each truck carries $19,887 a year of overhead.

Sources: Steph's Books HVAC margins. Per truck: ShareWillow (observations from 200-plus shops); Leach, ACHR News 2013 ($200K per service truck).

Open jobs

On track
Parkview Medical Suites
Rooftop unit replacement · Commercial · bid $108,000
costs still landing
Complete87%
Spent vs budget$62.9K of $72.0K
Projected margin33.3%bid 33.3%
Next invoice#2 · $54,000Nov 26

Tap to close. Cost groups and every line behind this card sit in the monthly report.

Michael Griffin
System replacement · Replacements and installs · bid $13,850
costs still landing
Complete63%
Spent vs budget$5.4K of $8.6K
Projected margin38.0%bid 38.0%
Next invoiceFinal · $9,695Ready to bill

Tap to close. Cost groups and every line behind this card sit in the monthly report.

Spent against budget is cost to date over the job budget. Labor posts at the monthly close.

Bills you owe

On track
Total
$82,327
$17,680 due in the next 14 days
Past due
$11,452
13.9% of what you owe
Equipment distributor · #B17512
due Nov 25
$52,600
Marketing agency · #B17503
due Oct 10
$9,499
Sheet metal subcontractor · #B17514
due Nov 6
$6,400
Equipment distributor · #B17520
due Nov 8
$4,591
Equipment distributor · #B17258
due Oct 18
$4,094
See the numbers as a table
AgeBillsAmount
Current7$70,875
1 to 30 days late3$11,452
31 to 60 days late0$0
61 to 90 days late0$0
Over 90 days late0$0
Total10$82,327

From Housecall Pro

On track
Tech hours booked, last 13 weeks
115%
125% for 90 days is the hire signal (Leach)
Booked work, next 4 weeks
$6,575
scheduled jobs and installs

Your software shows $156,395 for September, your books show $154,555. The difference is two invoices not yet exported.

Ask Frank about a number

Pick the number, ask in your own words. You get a reply by the next business day, and questions never cost extra.

This is a sample shop, so questions here go nowhere. Want this built on your own numbers? Book a call with Frank.
Ask Frank about a number
Sturdy NumbersSturdy NumbersSAMPLE

Monthly report · Books and live dashboard (Gauges)

Gray Heron Heating & Air, September 2026

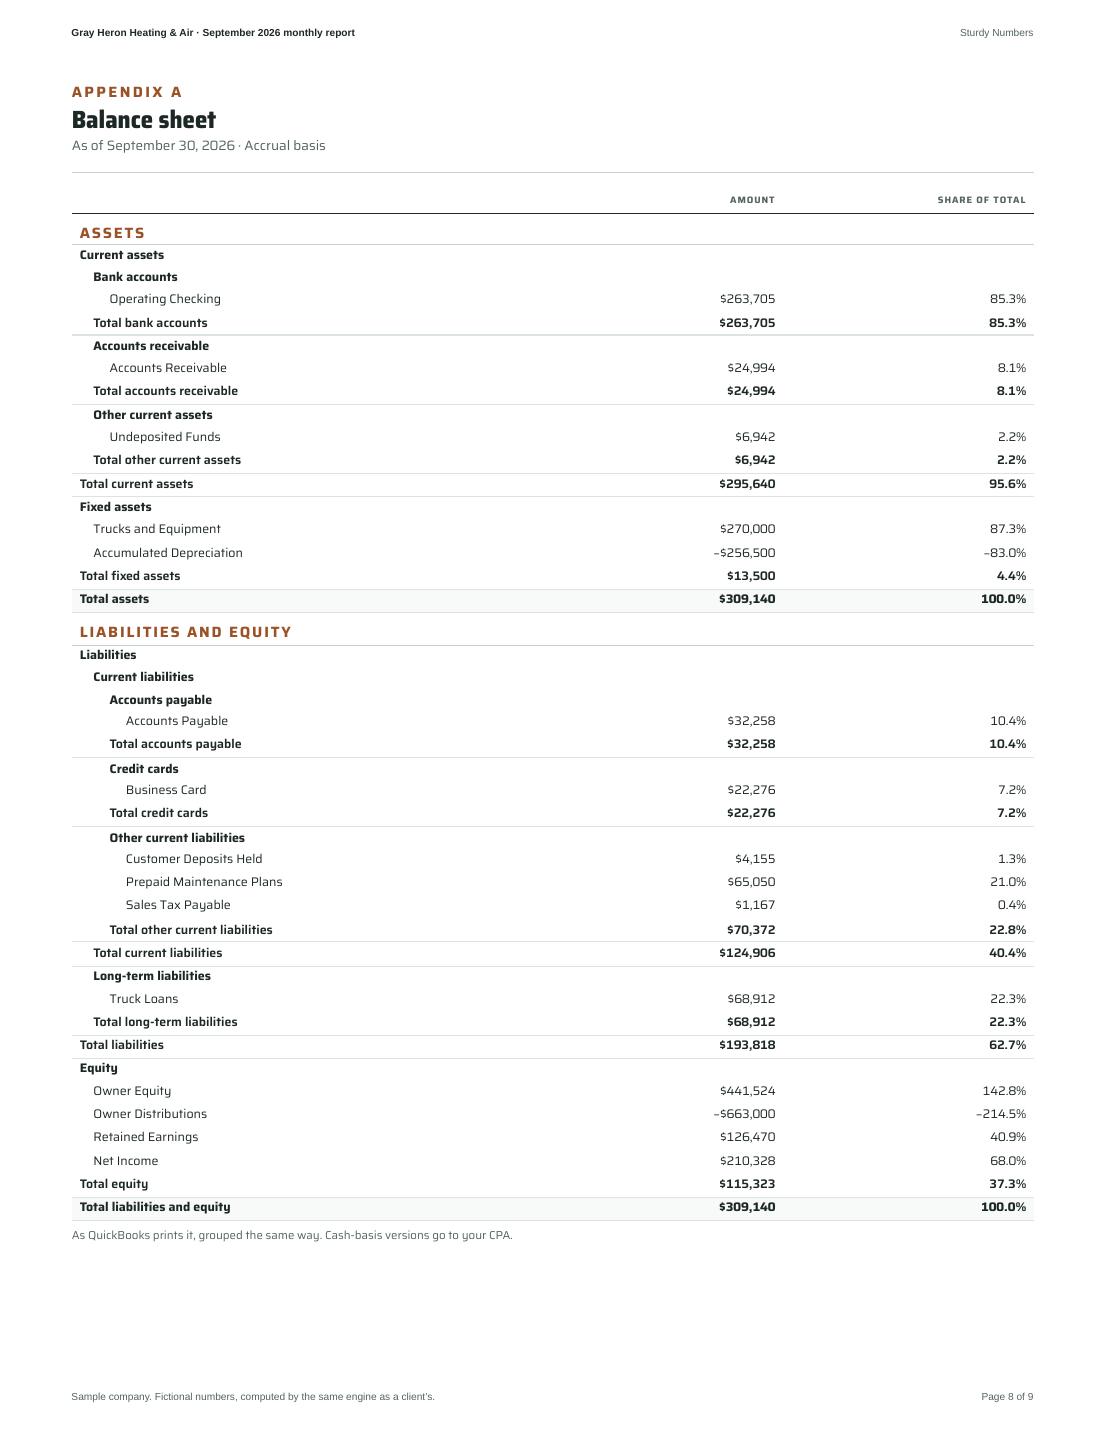
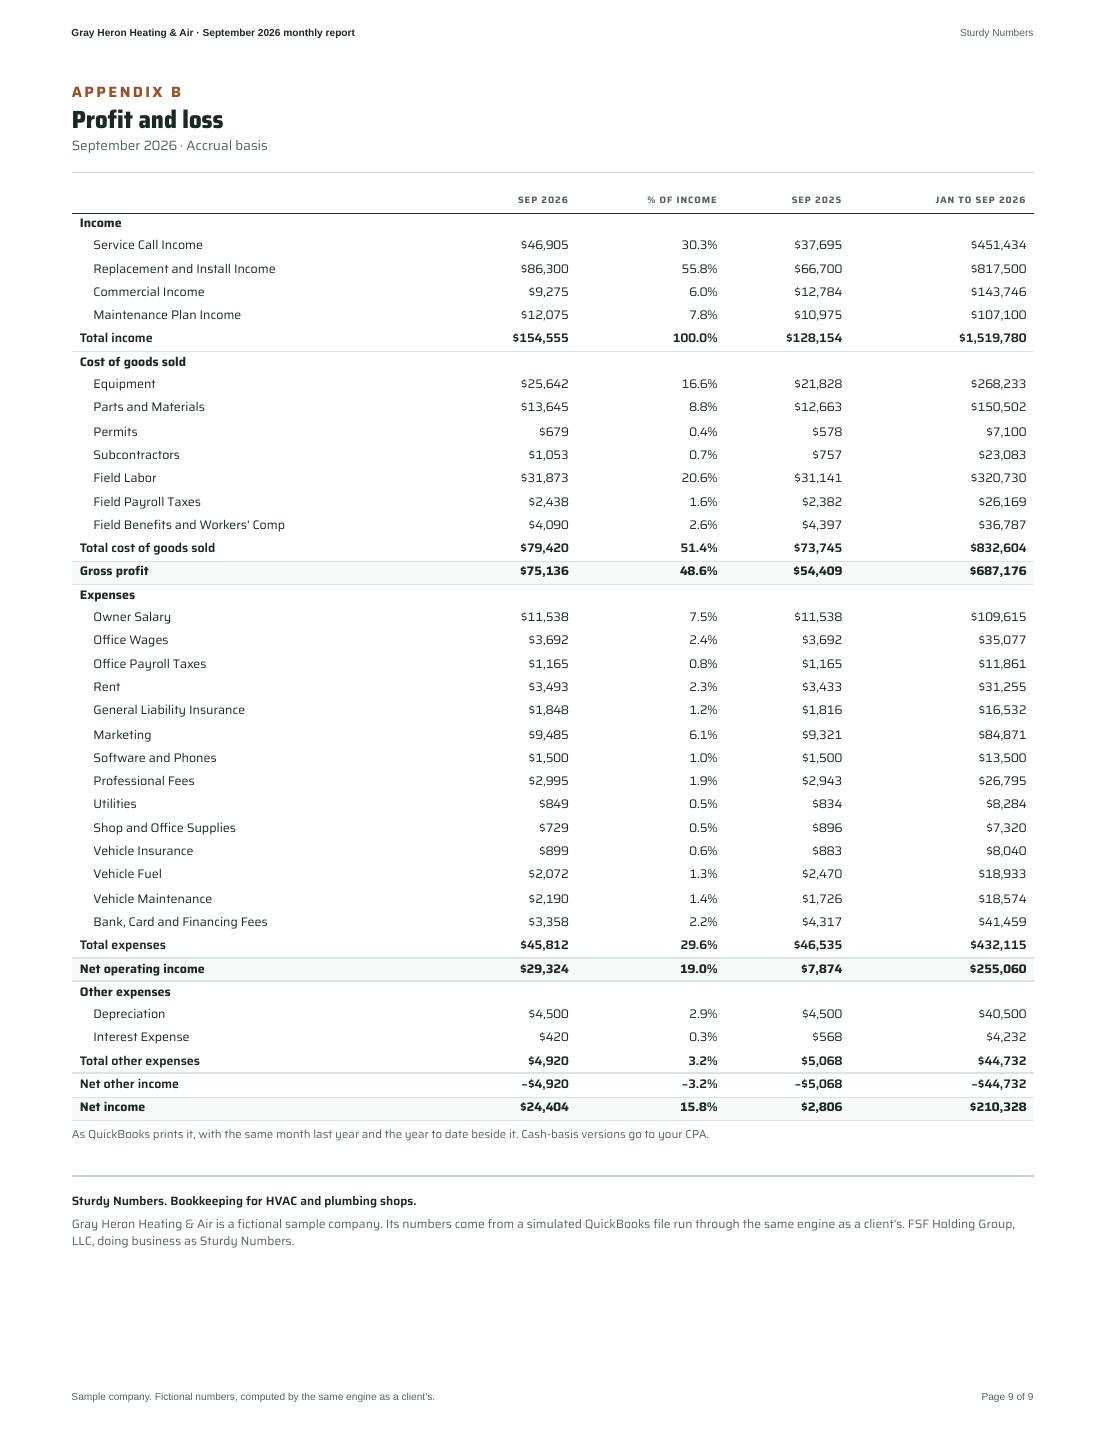
The report the owner gets after each close, page by page, exactly as it prints. On a phone, pinch to zoom in. The PDF copy sits in the same folder as this file.

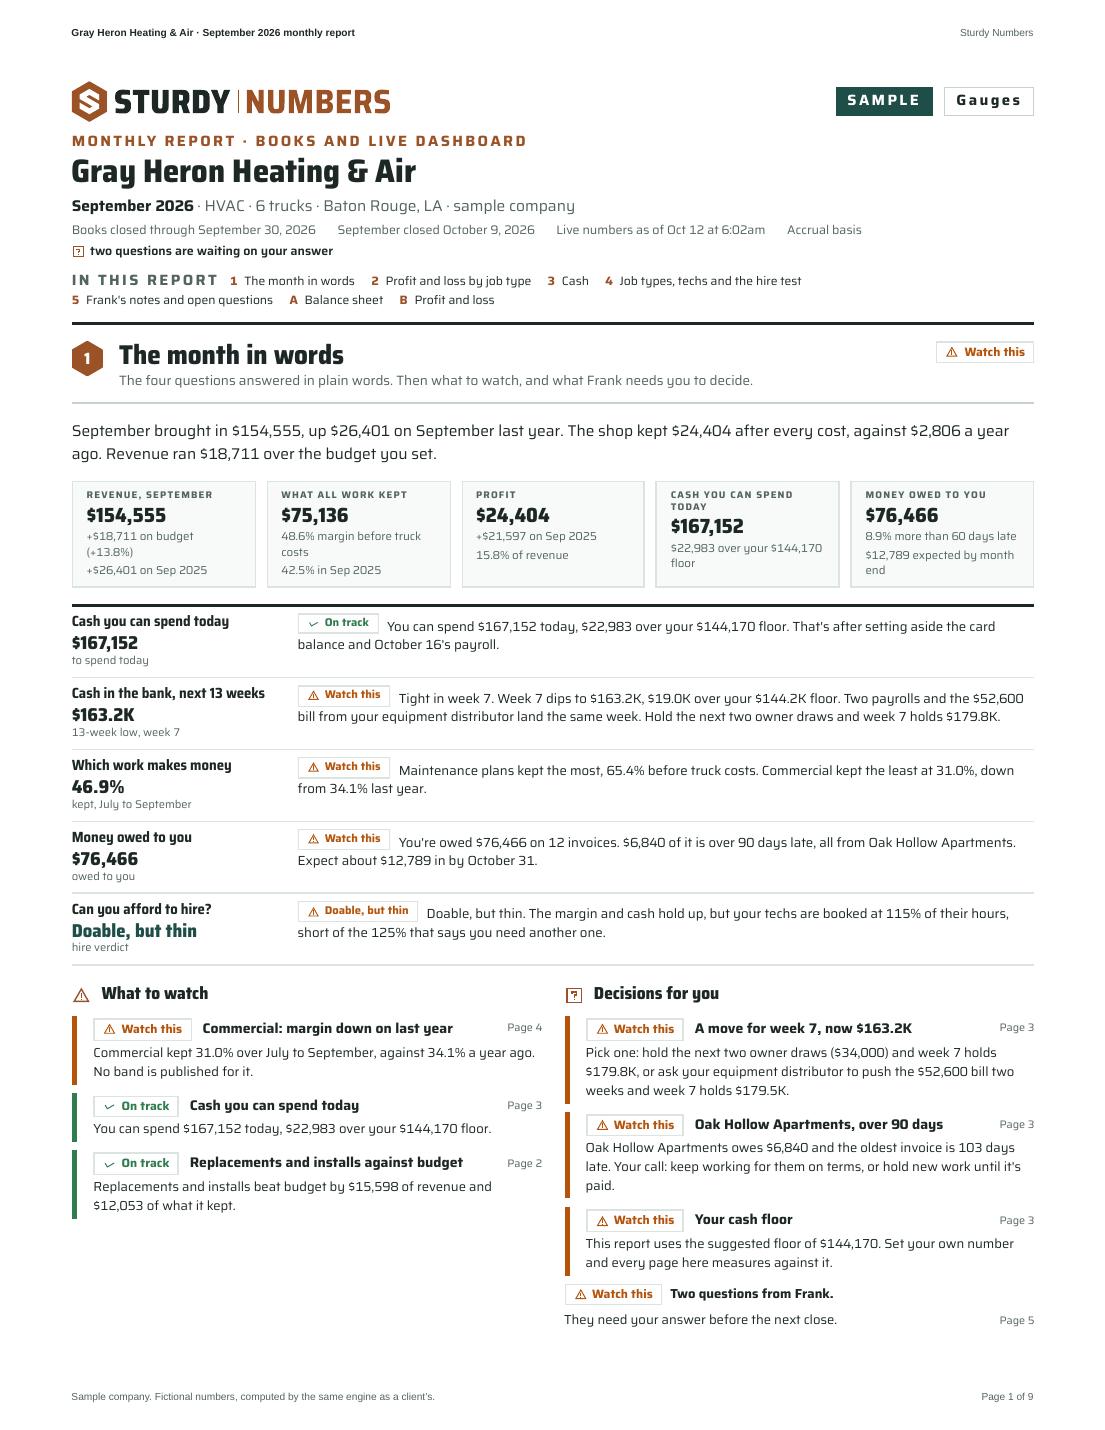
Gray Heron Heating & Air September 2026 monthly report, page 1 of 9
Page 1 of 9
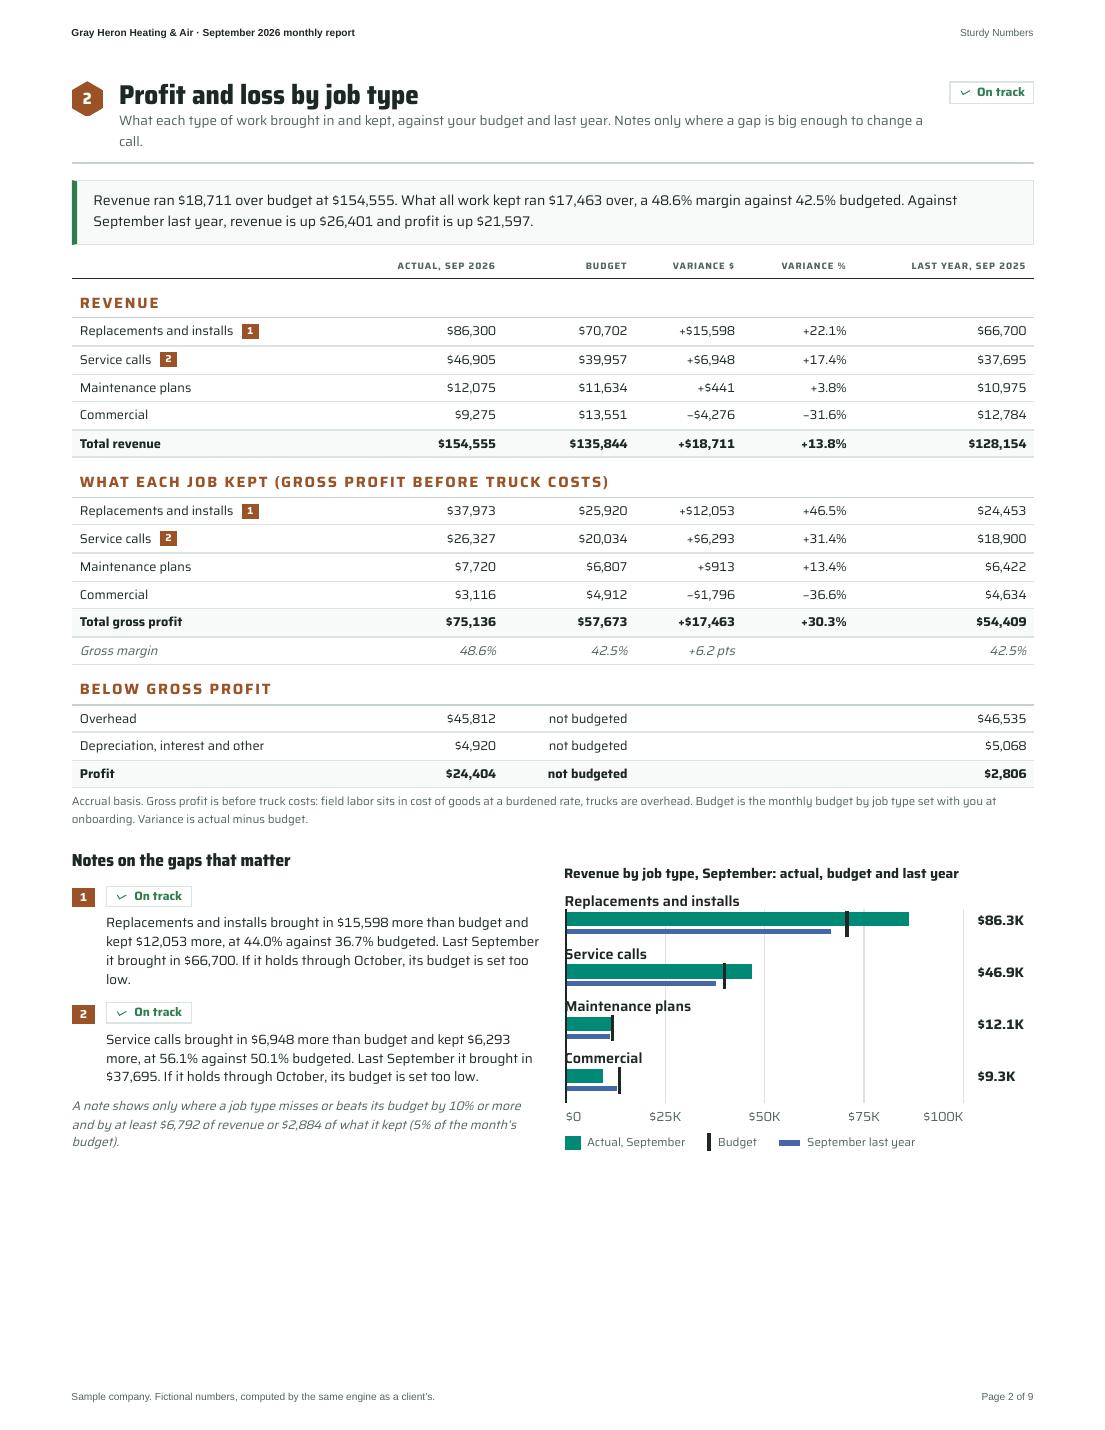
Gray Heron Heating & Air September 2026 monthly report, page 2 of 9
Page 2 of 9
Gray Heron Heating & Air September 2026 monthly report, page 3 of 9
Page 3 of 9
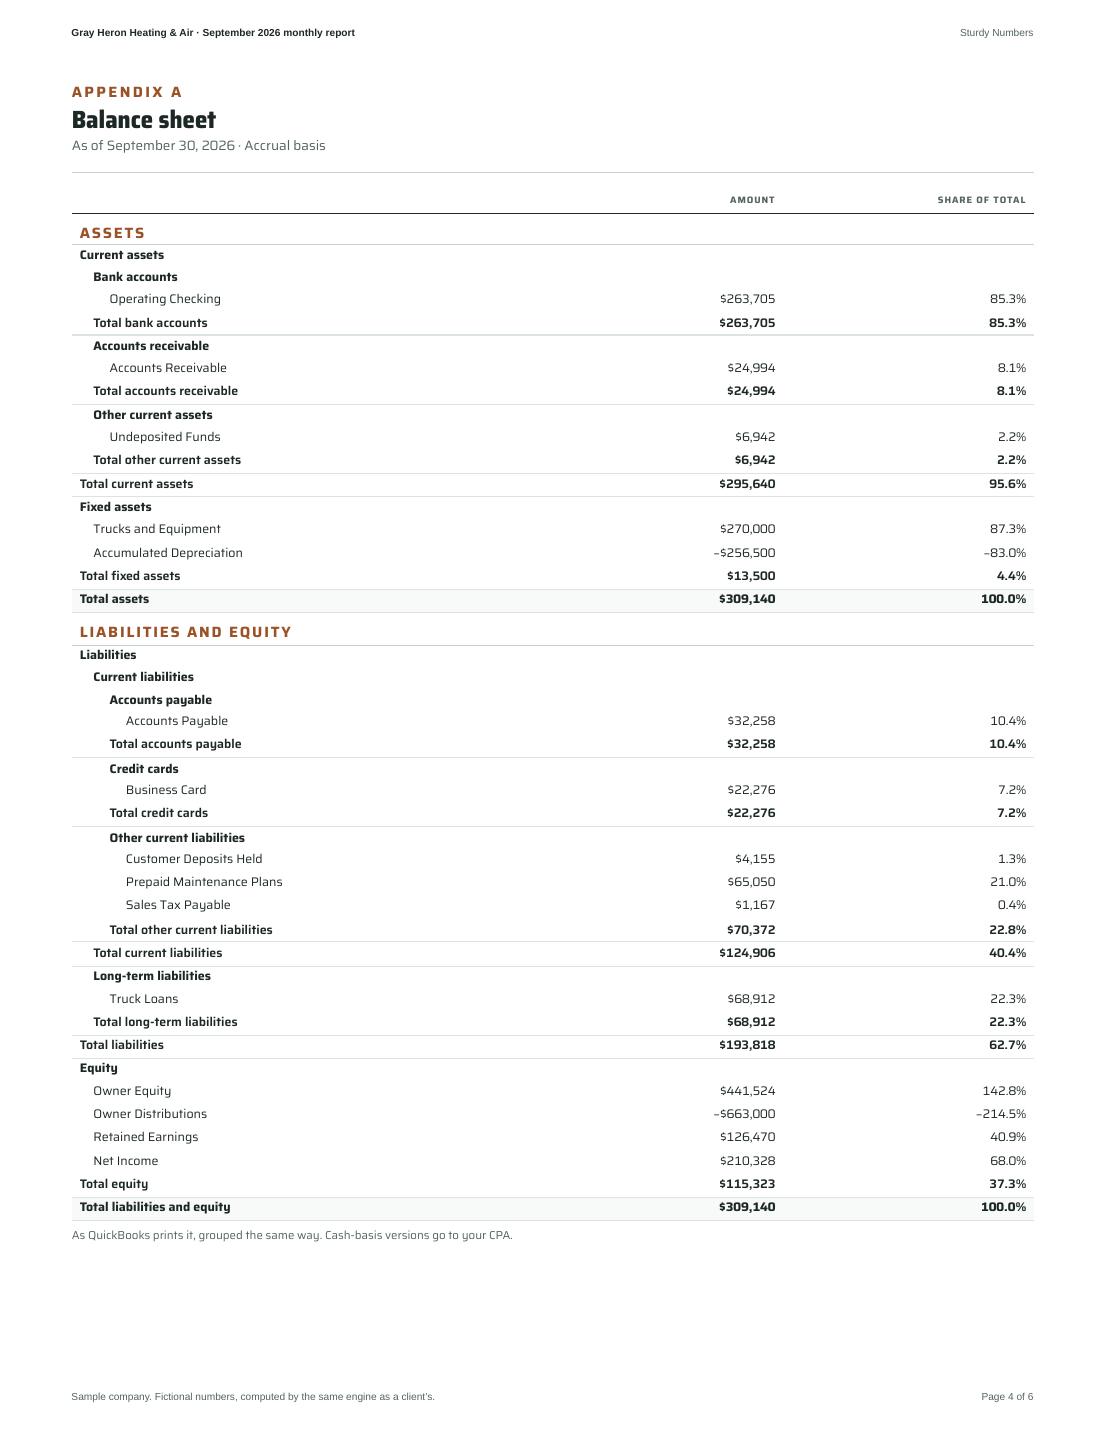
Gray Heron Heating & Air September 2026 monthly report, page 4 of 9
Page 4 of 9
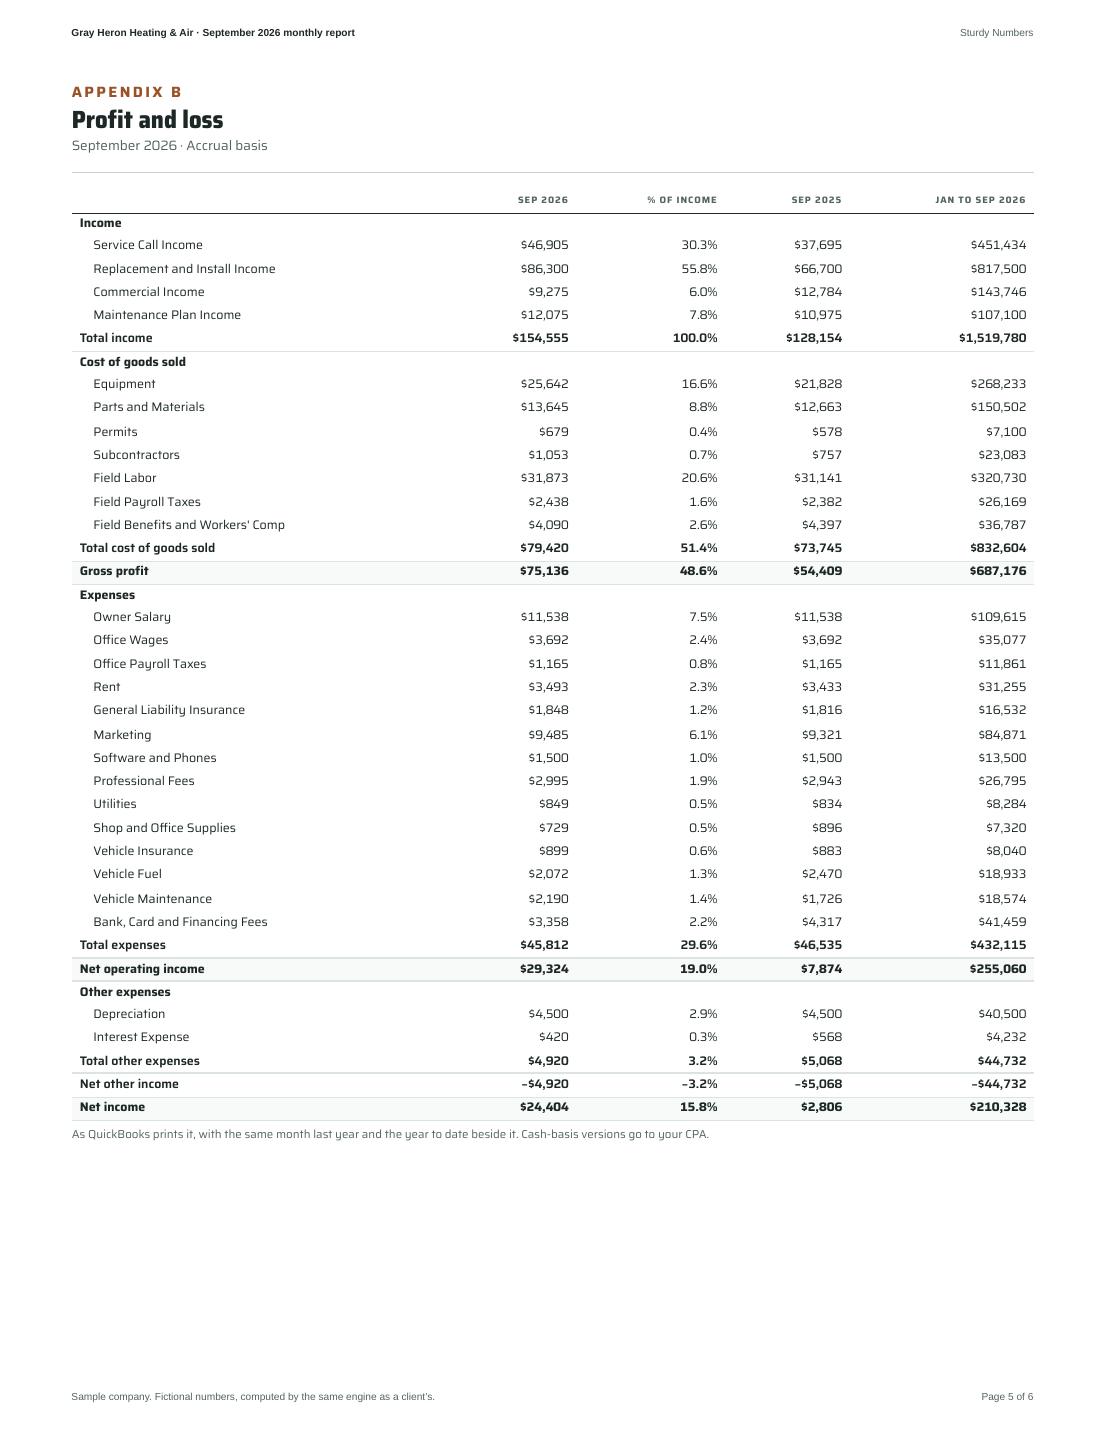
Gray Heron Heating & Air September 2026 monthly report, page 5 of 9
Page 5 of 9
Gray Heron Heating & Air September 2026 monthly report, page 6 of 9
Page 6 of 9
Gray Heron Heating & Air September 2026 monthly report, page 7 of 9
Page 7 of 9
Gray Heron Heating & Air September 2026 monthly report, page 8 of 9
Page 8 of 9
Gray Heron Heating & Air September 2026 monthly report, page 9 of 9
Page 9 of 9
Sturdy NumbersSturdy Numbers
SAMPLEMaintenance

Gray Heron Heating & Air

HVAC · 6 trucks · Baton Rouge, LA · sample company

Books reconciled through September 30, 2026Bank balance as of Oct 12 at 6:02amAccrual basisSeptember books closed Oct 9two questions are waiting on your answer

Your month: September

Your statements with a plain-English note. Close status up top.

September books closed
Sep 2026Sep 2025Budget
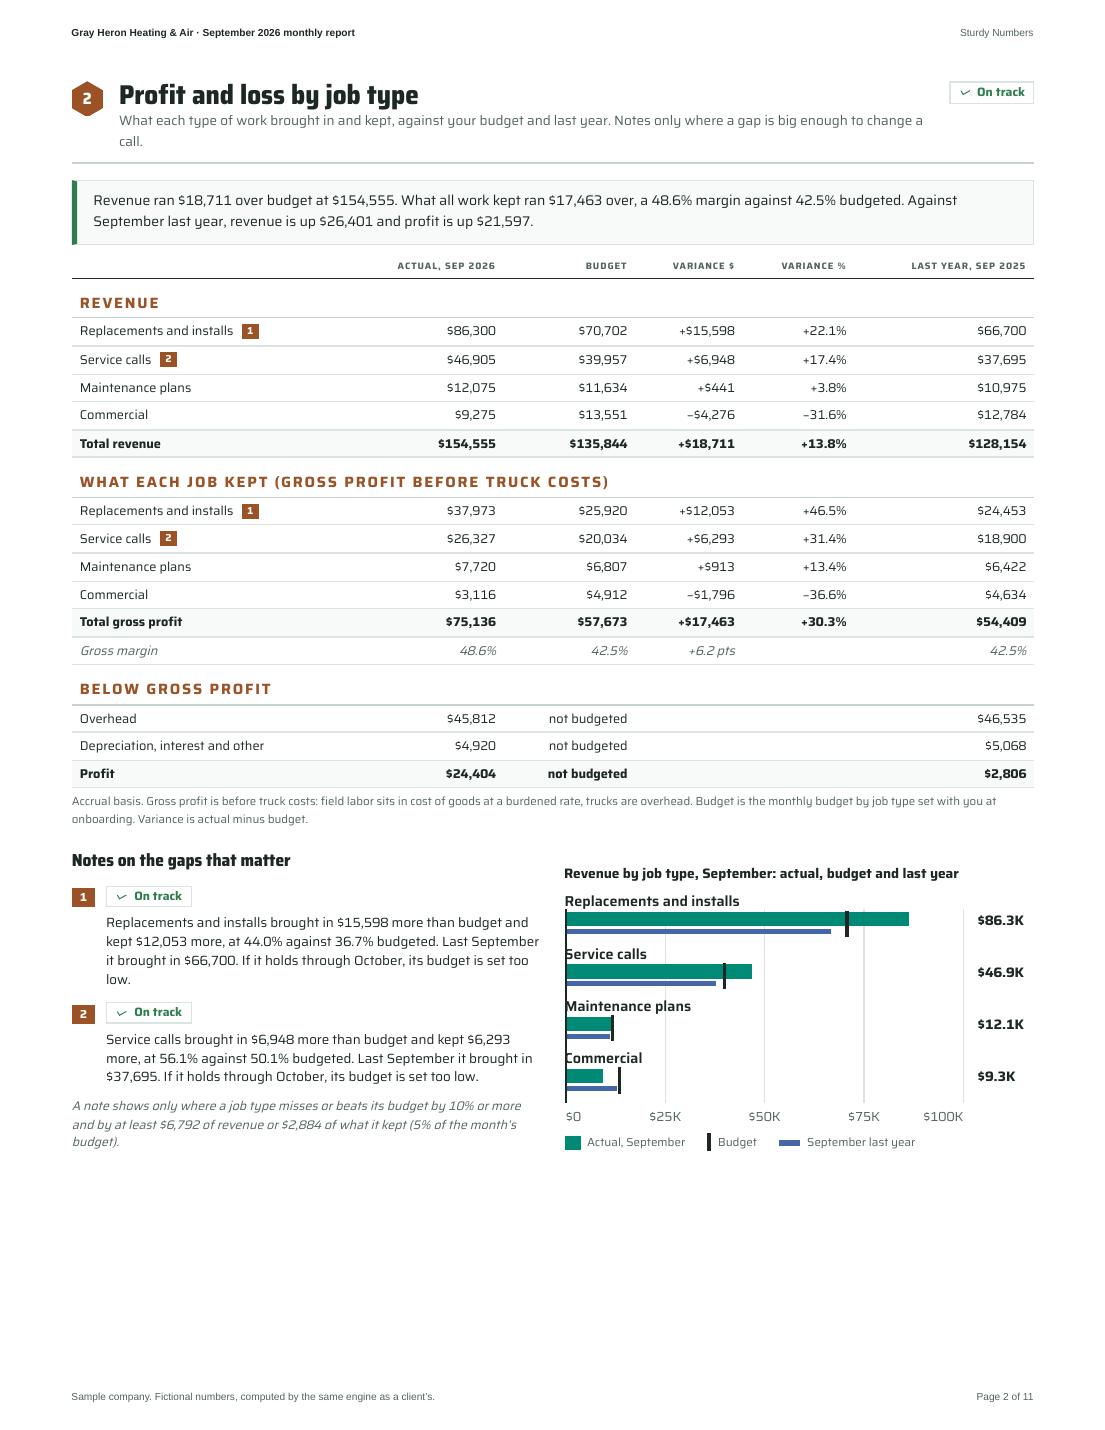
Revenue$154,555$128,154$135,844
Gross profit$75,136$54,409$57,673
Gross margin48.6%42.5%42.5%
Overhead$50,732$51,602
Profit$24,404$2,806

Gross profit is before truck costs. The budget you set covers revenue and gross profit by job type; overhead and profit are compared with last year only.

September brought in $154,555, up $26,401 on September last year. The shop kept $24,404 after every cost, against $2,806 a year ago. Revenue ran $18,711 over the budget you set.

Statements in this month's PDF

  • Profit and loss
  • Balance sheet
  • Money owed to you, by age
  • Bills you owe, by age

Open the monthly report

Monthly books doesn't include the live dashboard. The next tier up adds cash for the next 13 weeks, what each job kept, money owed and the hire test.

Sturdy NumbersSturdy NumbersSAMPLE

Monthly report · Monthly books (Maintenance)

Gray Heron Heating & Air, September 2026

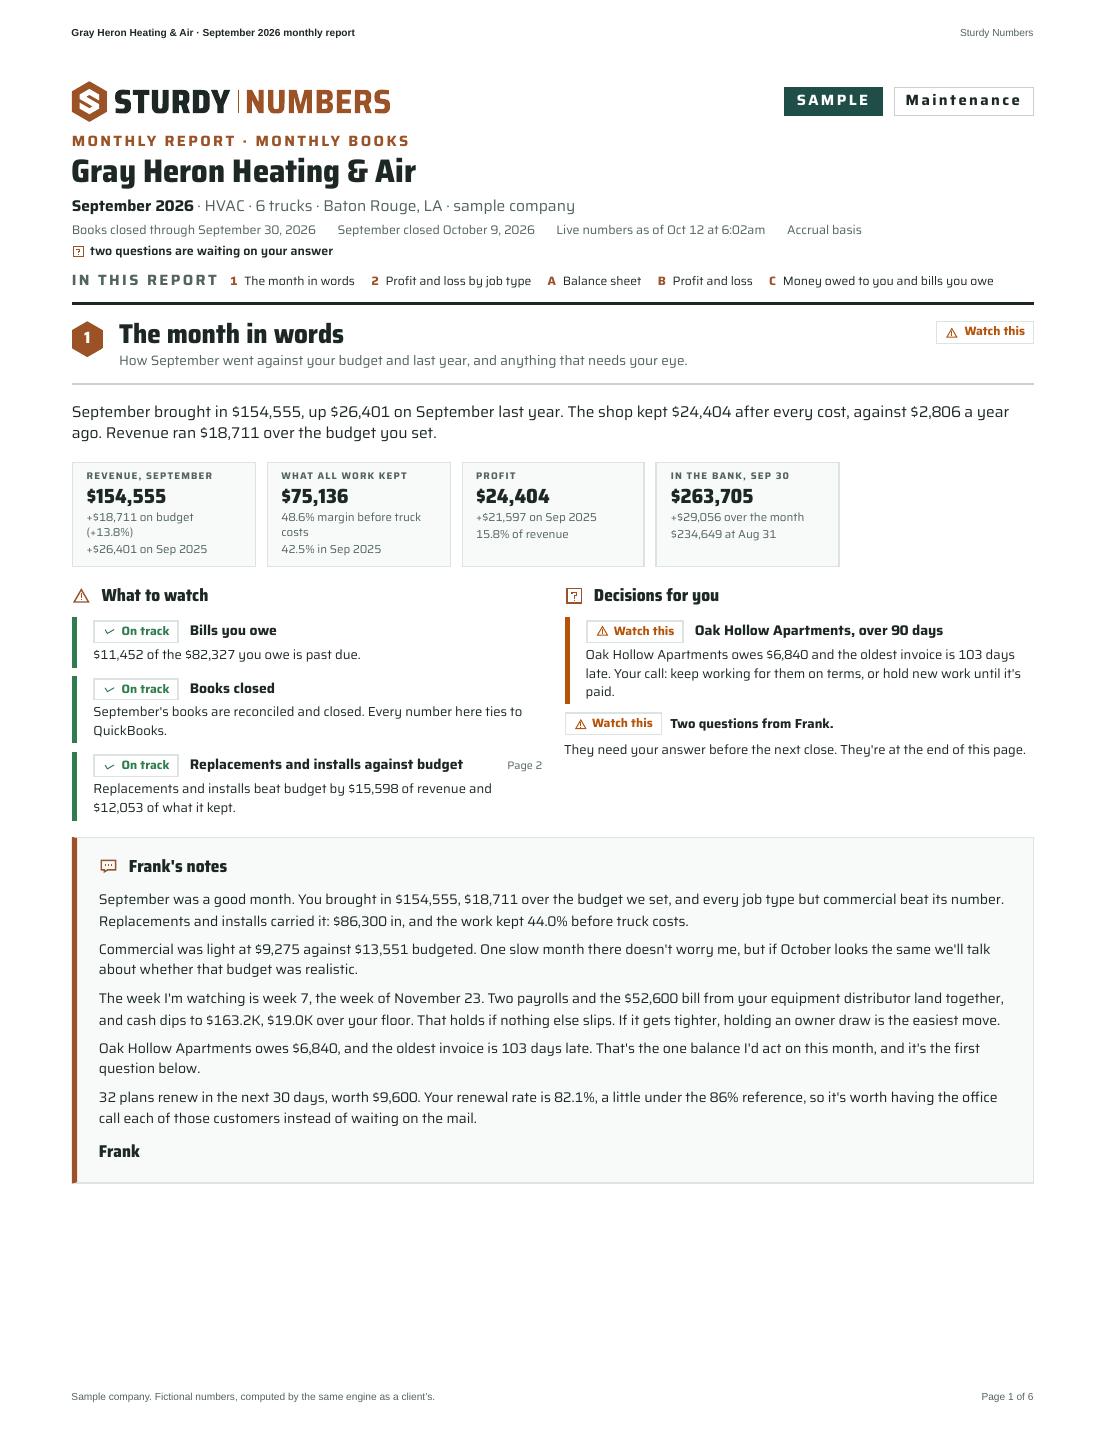
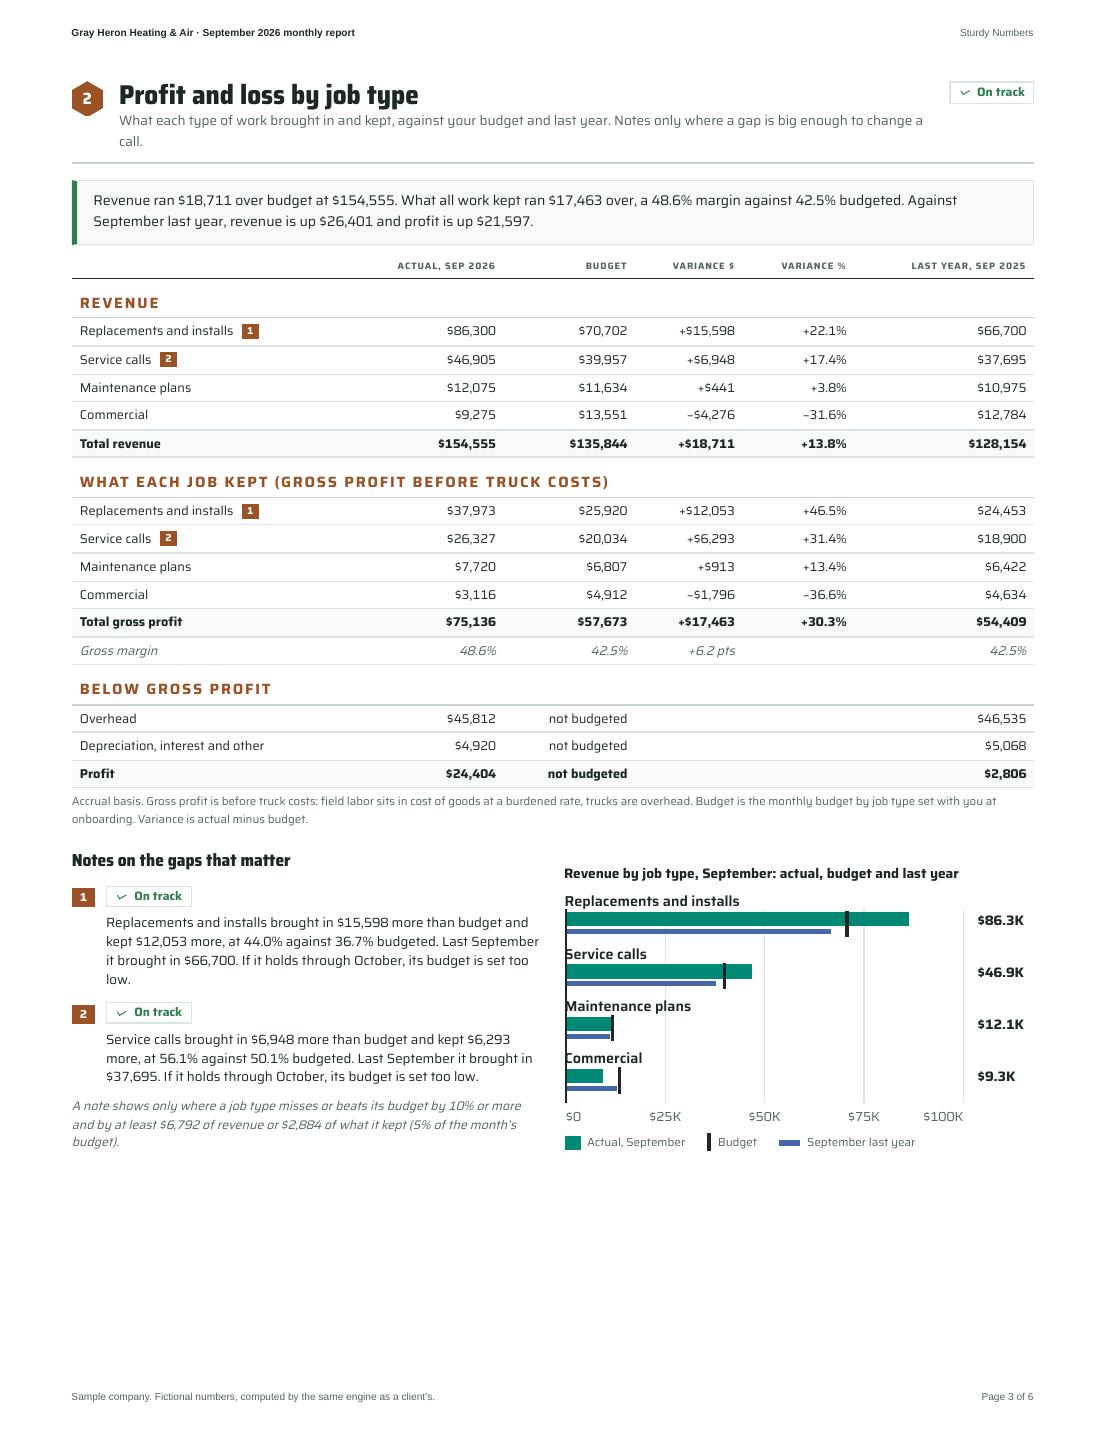
The report the owner gets after each close, page by page, exactly as it prints. On a phone, pinch to zoom in. The PDF copy sits in the same folder as this file.

Gray Heron Heating & Air September 2026 monthly report, page 1 of 6
Page 1 of 6
Gray Heron Heating & Air September 2026 monthly report, page 2 of 6
Page 2 of 6
Gray Heron Heating & Air September 2026 monthly report, page 3 of 6
Page 3 of 6
Gray Heron Heating & Air September 2026 monthly report, page 4 of 6
Page 4 of 6
Gray Heron Heating & Air September 2026 monthly report, page 5 of 6
Page 5 of 6
Gray Heron Heating & Air September 2026 monthly report, page 6 of 6
Page 6 of 6
Sturdy NumbersSturdy Numbers
SAMPLEBlueprint

Gray Heron Heating & Air

HVAC · 6 trucks · Baton Rouge, LA · sample company

Books reconciled through September 30, 2026Bank balance as of Oct 12 at 6:02amAccrual basisSeptember books closed Oct 9two questions are waiting on your answer

Your four questions and the hire test

Read top to bottom: cash now, cash ahead, which work pays, who owes you, then whether you can add a tech.

Monthly report

Cash you can spend today

What's yours to spend once you set aside what you already owe.

On track
$167,152

$22,983 over your $144,170 floor

In the bank (your books)$212,400
Received, not yet deposited$6,982
Customer deposits you’re holding− $4,155
Card balance due− $30,001
Sales tax owed− $1,283
Next payroll, Oct 16− $16,790
Cash you can spend$167,152

Uncleared items: $22,385 in checks your bank hasn't paid yet. Your bank shows $234,784.

You can spend $167,152 today, $22,983 over your $144,170 floor. That's after setting aside the card balance and October 16's payroll.

See the numbers as a table
PieceAmount
In the bank (your books)$212,400
Received, not yet deposited$6,982
Customer deposits you’re holding−$4,155
Card balance due−$30,001
Sales tax owed−$1,283
Next payroll, Oct 16−$16,790
Cash you can spend$167,152

Cash in the bank, next 13 weeks

Where cash is headed, week by week. Tight weeks show up here before they show up at payroll.

Watch this
13-week low
$163.2K
Week 7, Nov 23
First week under the floor
None
Floor $144.2K
Week 7 dips to $163.2K, $19.0K over your $144.2K floor. Two payrolls and the $52,600 bill from your equipment distributor land the same week. Hold the next two owner draws and week 7 holds $179.8K. $0$75K$150K$225K$300K Floor $144.2K $240.1K Week 7: $163.2K Wk 1Wk 2Wk 3Wk 4Wk 5Wk 6Wk 7Wk 8Wk 9Wk 10Wk 11Wk 12Wk 13
Ending cashYour floorSame weeks last yearRaise prices on commercial 8%Darker shading, firmer weeks

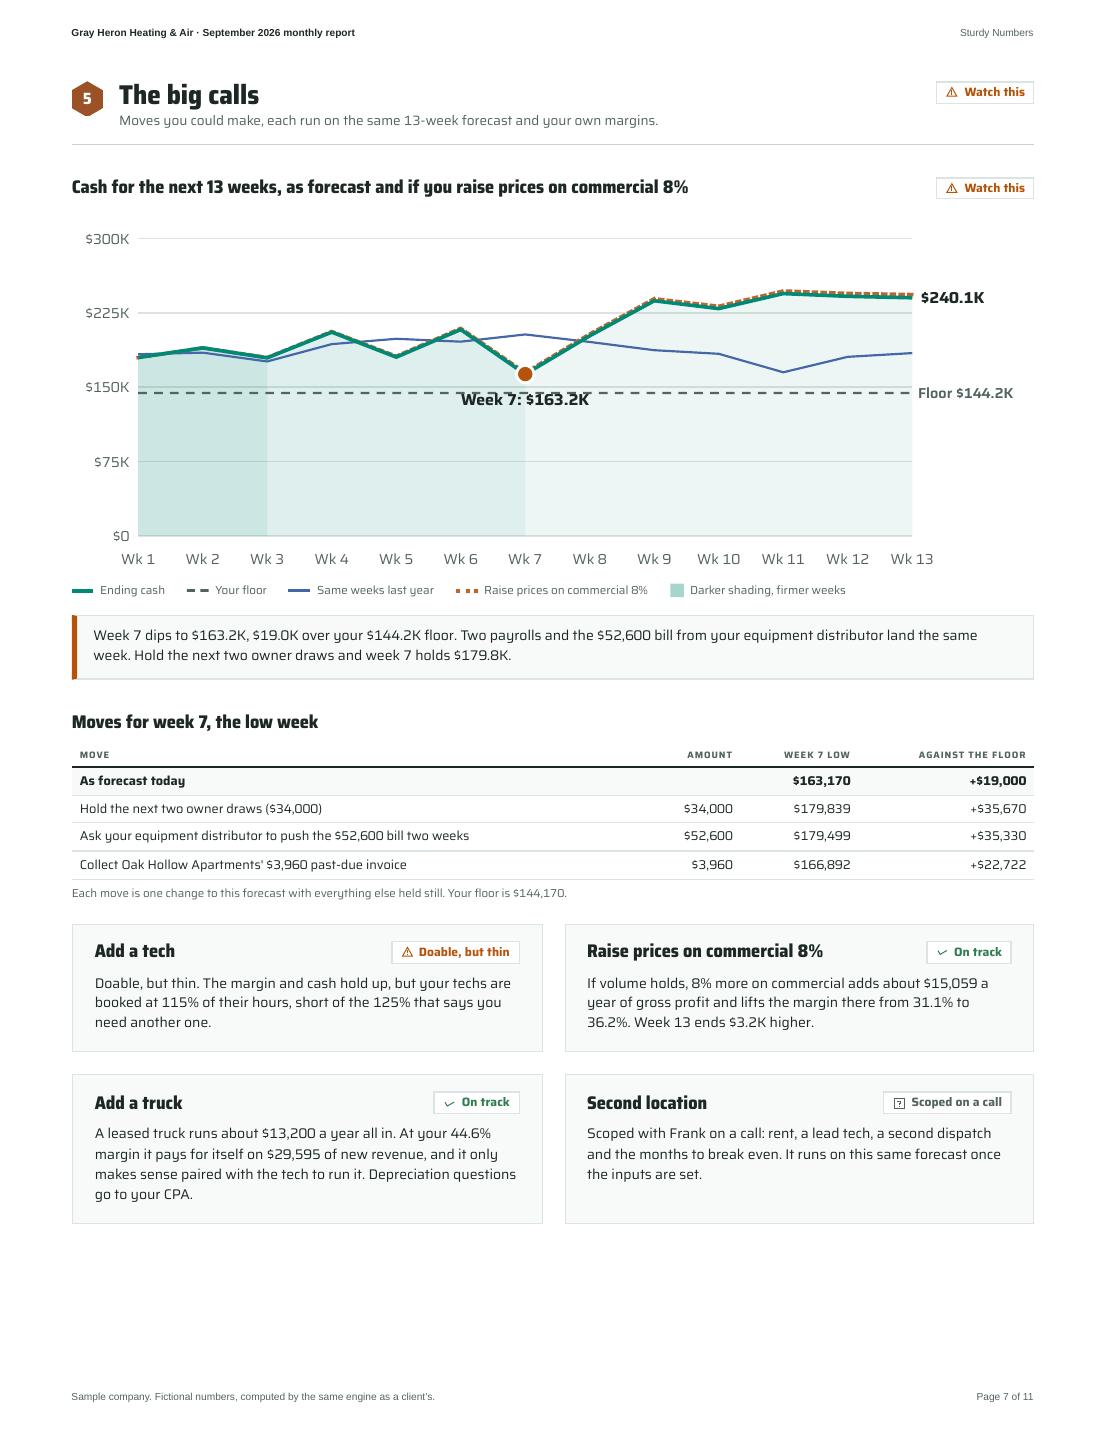
Week 7 dips to $163.2K, $19.0K over your $144.2K floor. Two payrolls and the $52,600 bill from your equipment distributor land the same week. Hold the next two owner draws and week 7 holds $179.8K.

Floor $144,170: the larger of $53,974 (next payroll plus a cushion) and $144,170 (three months of fixed costs). At one month it would be $53,974. You can change it any time.

At four weeks out, the ending-cash forecast has landed within $39.5K 80% of the time, over 26 weekly cycles.

±$20Kwk 1
±$24Kwk 2
±$34Kwk 3
±$40Kwk 4
±$41Kwk 5
±$48Kwk 6
±$53Kwk 7
±$64Kwk 8
±$63Kwk 9
±$71Kwk 10
±$71Kwk 11
±$76Kwk 12
±$68Kwk 13

DefaultCollection curve. The later aging buckets use the Gaviti default until about 30 of your own paid invoices land in each.

Shading darkens with confidence: weeks 1 and 2 come from scheduled items, 3 to 6 from approved bills and booked work, 7 to 13 from your seasonal pattern.

See the numbers as a table
Bank basis: week 1 opens at the balance your bank shows; checks not yet cleared come out in week 1.
LineWk 1Wk 2Wk 3Wk 4Wk 5Wk 6Wk 7Wk 8Wk 9Wk 10Wk 11Wk 12Wk 13
Week startingOct 12Oct 19Oct 26Nov 2Nov 9Nov 16Nov 23Nov 30Dec 7Dec 14Dec 21Dec 28Jan 4
Opening cash (bank)$234,784$179,839$189,619$179,499$205,424$180,343$208,125$163,170$201,807$237,095$229,262$244,314$241,606
+ Deposits on the way and received, not deposited$6,982$0$0$0$0$0$0$0$0$0$0$0$0
+ Collections on money owed to you$2,598$5,407$5,580$2,142$103$103$13,603$27,103$13,603$103$103$103$103
+ Booked work (from your job software)$3,598$1,741$696$540$0$0$0$0$54,000$0$0$0$0
+ Maintenance plan renewals$2,520$1,512$1,764$2,268$1,260$2,520$3,024$3,528$2,772$3,276$3,024$2,772$1,764
+ Financing company payouts$8,919$0$0$0$0$0$0$0$0$0$0$0$0
+ Work not booked yet (your last three years)$4,264$16,744$25,702$36,193$36,733$36,715$36,711$36,619$0$36,622$36,726$36,862$37,405
− Payroll with employer taxes$16,790$8,593$16,790$8,593$16,790$8,593$16,790$8,593$16,790$8,593$16,790$8,593$16,790
− Checks written, not cleared yet$22,385$0$0$0$0$0$0$0$0$0$0$0$0
− Owner draws (your call)$0$0$17,000$0$0$0$17,000$0$0$0$0$17,000$0
− Bills you owe, by due date$11,452$4,999$1,228$1,056$10,991$0$52,600$0$0$0$0$0$0
− Rent, insurance and other fixed costs$3,199$750$8,843$3,000$13,599$750$0$11,843$10,400$3,949$0$8,843$13,400
− Truck and equipment loans$0$0$0$2,570$0$0$0$2,570$0$0$0$0$2,570
− Credit card payment$30,001$0$0$0$21,796$0$0$0$0$21,796$0$0$0
− Sales tax$0$1,283$0$0$0$1,283$0$0$0$1,283$0$0$0
− Insurance, true-ups and estimates$0$0$0$0$0$0$8,250$0$0$4,200$0$0$0
− Parts for work not booked yet$0$0$0$0$0$930$3,653$5,607$7,896$8,014$8,010$8,009$7,989
Ending cash$179,839$189,619$179,499$205,424$180,343$208,125$163,170$201,807$237,095$229,262$244,314$241,606$240,129
Your floor$144,170$144,170$144,170$144,170$144,170$144,170$144,170$144,170$144,170$144,170$144,170$144,170$144,170
Same week last year$183,156$184,854$175,852$193,454$198,752$195,835$203,224$195,643$187,332$183,654$164,960$180,630$184,394
Customer deposits held (in the totals above)$4,155$4,155$4,155$4,155$4,155$4,155$4,155$4,155$4,155$4,155$4,155$4,155$4,155

Which work makes money

Revenue and what each type of job kept, before truck costs.

Watch this
Revenue, last 3 months
$571.4K
$571,400 against a $531,000 goal
What all work kept
46.9%
before truck costs
Replacements and installs$307.1K · 41.5%
53.8% of revenuekept 41.5%
Band: 35% to 50%in the band
Service calls$172.9K · 57.9%
30.3% of revenuekept 57.9%
Band: 50% to 65%in the band
Commercial$55.1K · 31.0%
9.6% of revenuekept 31.0%
Band: no published bandlast year 34.1%
Maintenance plans$36.3K · 65.4%
6.4% of revenuekept 65.4%
Band: 40% to 60%above the band

Maintenance plans kept the most, 65.4% before truck costs. Commercial kept the least at 31.0%, down from 34.1% last year.

See the numbers as a table
Gross margin before truck costs. Technician labor is in cost of goods at a burdened rate; trucks are overhead. Bands: Steph's Books HVAC margins; Hook Agency; Margin One (25 to 40%); PHCC (40 to 50% on service calls).
Job typeRevenueShareCost of goodsGross profitMarginTarget bandLast year margin
Replacements and installs$307,15053.8%$179,760$127,39041.5%35% to 50%38.8%
Service calls$172,88430.3%$72,862$100,02257.9%50% to 65%54.7%
Commercial$55,0669.6%$38,002$17,06431.0%none published34.1%
Maintenance plans$36,3006.4%$12,543$23,75765.4%40% to 60%62.0%
All job types$571,400100.0%$303,166$268,23446.9%

July to September, closed months. Bars show revenue; the thin line under each shows what it kept, with the target band shaded.

Revenue, last 12 months
$1.97M
$1,967,381 against a $2,124,000 goal
What all work kept
44.6%
before truck costs
Replacements and installs$1.05M · 39.2%
53.5% of revenuekept 39.2%
Band: 35% to 50%in the band
Service calls$586.4K · 54.7%
29.8% of revenuekept 54.7%
Band: 50% to 65%in the band
Commercial$188.2K · 31.1%
9.6% of revenuekept 31.1%
Band: no published bandno published band
Maintenance plans$140.5K · 61.3%
7.1% of revenuekept 61.3%
Band: 40% to 60%above the band

Maintenance plans kept the most, 61.3% before truck costs. Commercial kept the least at 31.1%.

See the numbers as a table
Gross margin before truck costs. Technician labor is in cost of goods at a burdened rate; trucks are overhead. Bands: Steph's Books HVAC margins; Hook Agency; Margin One (25 to 40%); PHCC (40 to 50% on service calls).
Job typeRevenueShareCost of goodsGross profitMarginTarget bandLast year margin
Replacements and installs$1,052,25053.5%$640,262$411,98839.2%35% to 50%n/a
Service calls$586,39629.8%$265,617$320,77954.7%50% to 65%n/a
Commercial$188,2359.6%$129,668$58,56731.1%none publishedn/a
Maintenance plans$140,5007.1%$54,345$86,15561.3%40% to 60%n/a
All job types$1,967,381100.0%$1,089,892$877,48944.6%

October to September, closed months. Bars show revenue; the thin line under each shows what it kept, with the target band shaded.

Money owed to you

Unpaid invoices, by how long they're late. Tap a customer to call.

Watch this
Total owed
$76,466
8.9% more than 60 days late
Expected in by the end of October
$12,789
from your payment history, default curve for the later buckets
Current$64,169
1 to 30 days late$5,457
31 to 60 days late$0
61 to 90 days late$0
Over 90 days late$6,840

Five biggest balances (sample phone numbers)

Parkview Medical Suites
10 days late
$55,898
Sherwood Self Storage
not due yet
$8,159
Oak Hollow Apartments
103 days late
$6,840
Riverside Church Fellowship Hall
25 days late
$1,959
James Carter
not due yet
$992

You're owed $76,466 on 12 invoices. $6,840 of it is over 90 days late, all from Oak Hollow Apartments. Expect about $12,789 in by October 31.

See the numbers as a table
AgeInvoicesAmountShare
Current6$64,16983.9%
1 to 30 days late4$5,4577.1%
31 to 60 days late0$00.0%
61 to 90 days late0$00.0%
Over 90 days late2$6,8408.9%
Total owed12$76,466100.0%

Can you afford to hire?

Set the all-in monthly cost: wage, payroll taxes, insurance, phone and the truck.

Doable, but thin
$7,700
Profit left each month with the hire, at full speed
$23,776
Months your cushion over the floor covers the full cost
2.5
Doable, but thin. The margin and cash hold up, but your techs are booked at 115% of their hours, short of the 125% that says you need another one.

Cash with and without the hire

Ending cash for 13 weeks. The dotted line carries the hire's cost while the new tech ramps up.

Cash for the next 13 weeks, without and with the hire $0$200K$400K Wk 1Wk 3Wk 5Wk 7Wk 9Wk 11Wk 13
Without the hireWith the hireYour floor

Demand: your techs are booked at 115% of their hours (Housecall Pro, last 13 weeks).

Cover: 1.48 on the service calls margin, 54.7%.

Cash: $17,739 over your floor at the tightest week with the hire.

Slowest three months (Apr, Oct, Mar): with one more tech, each would bring in about $16,507 a month, against the $14,076 a month the hire needs to break even.

See the numbers as a table
WeekWithout the hireWith the hireFloor
Wk 1$179,839$179,377$144,170
Wk 2$189,619$188,695$144,170
Wk 3$179,499$178,113$144,170
Wk 4$205,424$203,576$144,170
Wk 5$180,343$178,691$144,170
Wk 6$208,125$206,668$144,170
Wk 7$163,170$161,909$144,170
Wk 8$201,807$200,741$144,170
Wk 9$237,095$236,883$144,170
Wk 10$229,262$229,903$144,170
Wk 11$244,314$245,808$144,170
Wk 12$241,606$243,953$144,170
Wk 13$240,129$243,329$144,170

Revenue the hire must produce

To break even
$168,911
a year, at the margin above
At a 12% profit
$216,376
a year

Rules of thumb, which disagree by more than two to one:

  • $200,000 a year per service truck (Leach, 2013)
  • $343,200 per single-tech truck (Ruth King's hourly build-up)
  • $461,958 at five times burdened cost, a stretch goal, not a gate

Trucks: the cost above includes a dedicated truck. We plan the Section 179 and bonus depreciation timing with you. Your CPA files the return.

See the numbers as a table
Default costs from the Sturdy research, labeled defaults until your own numbers replace them.
CostA yearA month
Base pay$62,940$5,245
Social Security and Medicare$4,815$401
Federal unemployment$42$4
State unemployment$140$12
Workers' comp$2,455$205
Health insurance$5,400$450
Truck (lease, insurance, upkeep)$12,600$1,050
Software seat$3,000$250
Training$1,000$83
All in$92,392$7,699

Help with the big calls

Scenarios run on the same 13-week forecast and your own margins.

Add a tech

Doable, but thin

Doable, but thin. The margin and cash hold up, but your techs are booked at 115% of their hours, short of the 125% that says you need another one.

Raise prices on commercial 8%

On track

If volume holds, 8% more on commercial adds about $15,059 a year of gross profit and lifts the margin there from 31.1% to 36.2%. Week 13 ends $3.2K higher.

Add a truck

On track

A leased truck runs about $13,200 a year all in. At your 44.6% margin it pays for itself on $29,595 of new revenue, and it only makes sense paired with the tech to run it. Depreciation questions go to your CPA.

Second location

Scoped on a call

Scoped with Frank on a call: rent, a lead tech, a second dispatch and the months to break even. It runs on this same forecast once the inputs are set.

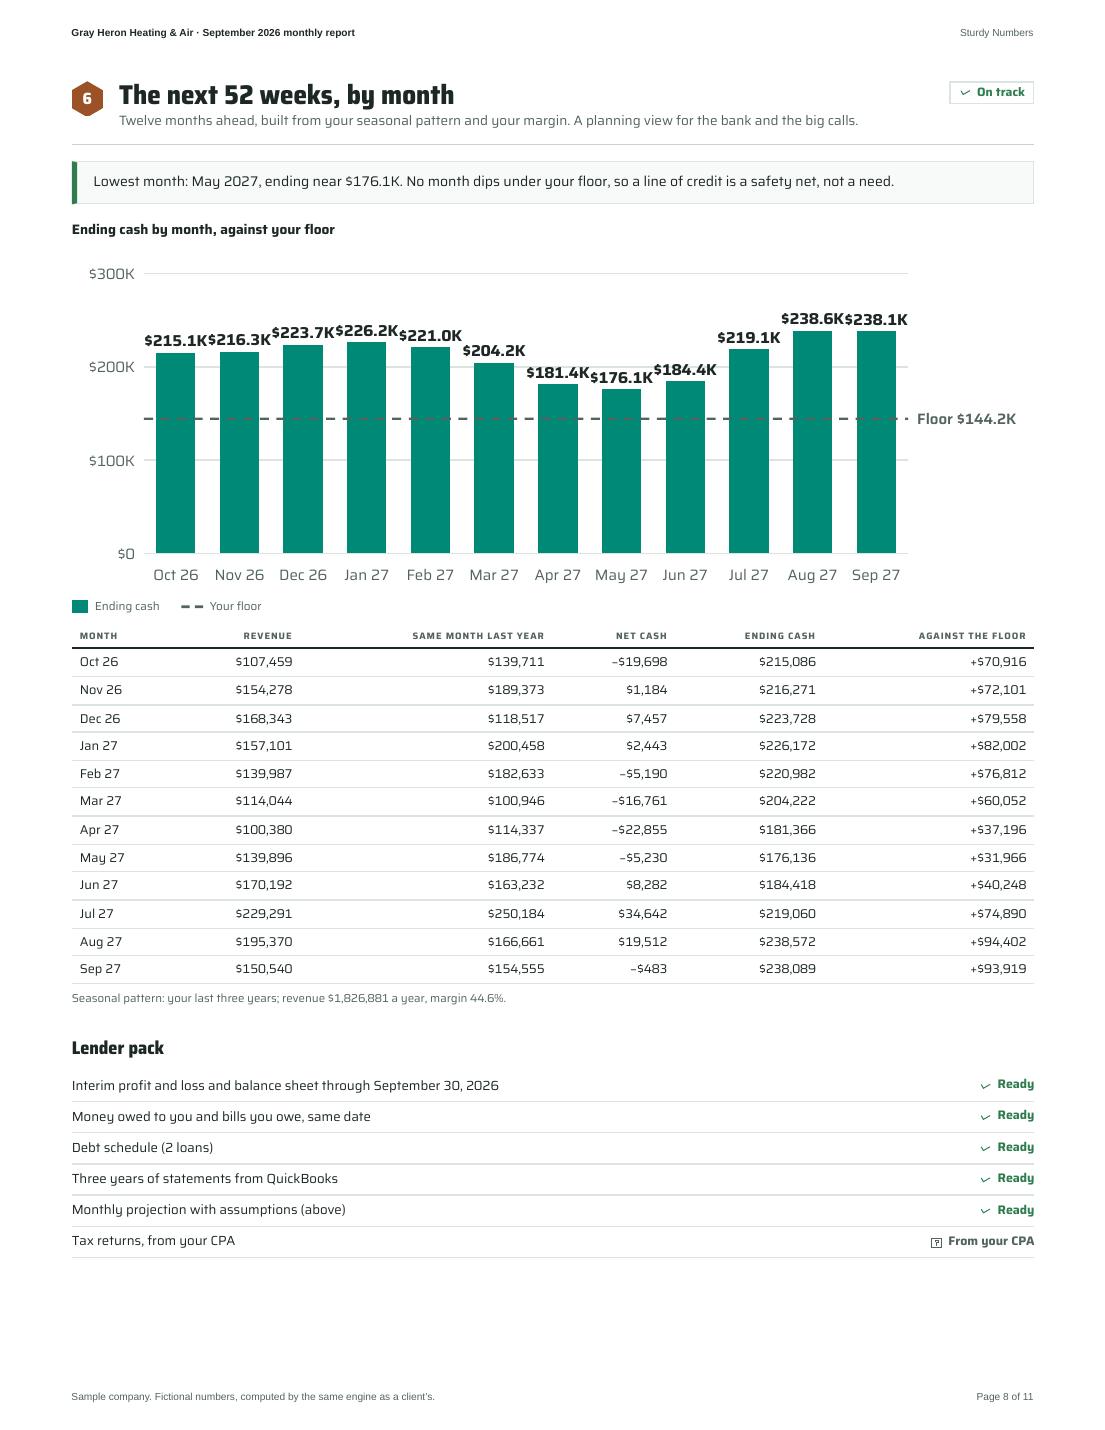
The next 52 weeks, by month

Projection

your last three years; revenue $1,826,881 a year, margin 44.6%

Oct 26$215,086
Nov 26$216,271
Dec 26$223,728
Jan 27$226,172
Feb 27$220,982
Mar 27$204,222
Apr 27$181,366
May 27$176,136
Jun 27$184,418
Jul 27$219,060
Aug 27$238,572
Sep 27$238,089

Lowest month: May 2027, ending near $176.1K. No month dips under your floor, so a line of credit is a safety net, not a need.

See the numbers as a table
MonthRevenueNet cashEnding cash
Oct 26$107,459−$19,698$215,086
Nov 26$154,278$1,184$216,271
Dec 26$168,343$7,457$223,728
Jan 27$157,101$2,443$226,172
Feb 27$139,987−$5,190$220,982
Mar 27$114,044−$16,761$204,222
Apr 27$100,380−$22,855$181,366
May 27$139,896−$5,230$176,136
Jun 27$170,192$8,282$184,418
Jul 27$229,291$34,642$219,060
Aug 27$195,370$19,512$238,572
Sep 27$150,540−$483$238,089

Lender pack

What a bank asks for, built from the monthly close.

  • Interim profit and loss and balance sheet through September 30, 2026Ready
  • Money owed to you and bills you owe, same dateReady
  • Debt schedule (2 loans)Ready
  • Three years of statements from QuickBooksReady
  • Monthly projection with assumptions (above)Ready
  • Tax returns, from your CPAFrom your CPA

The rest of the picture

The numbers behind the numbers, and anything Frank is working on.

Data quality
Books are clean through the last close. Every number ties to QuickBooks.
On track
  • Every September cost is assigned to a job type.On track
  • 2 open jobs are still collecting costs; labor posts at the monthly close.On track
  • Field payroll is split by job type through the last close.On track
  • Payments received but not yet deposited are shown apart from cash in the bank.On track
  • Book and bank agree through the last statement.On track
  • No late invoice has an unapplied payment sitting beside it.On track
  • Owner draws sit in equity, not expenses.On track
  • Your job software shows $156,395 for September, your books show $154,555. The difference is two invoices not yet exported.On track

Recurring base

On track
Active plans
474
19.0% of your 2,500 customers; best-in-class is 30% to 50%
Annual value
$142,200
$225,000 at 30%
Renewals due in 30 days
32
$9,600
Renewal rate
82.1%
86% reference

474 customers are on a plan, 19.0% of your customers. Most shops sit under 15%. At 30% the base would bring in $225,000 a year.

Sources: Plan invoices in QuickBooks. Reference: Contracting Business, 2016; Margin One (best-in-class residential).

Revenue per tech and per truck

On track
Per field tech, last 12 months
$281,054
above the well-run band; well-run band $150,000 to $250,000
Per truck
$327,897
$200K to $300K is solid
Truck overhead per truck
$19,887
fuel, insurance, upkeep, interest and depreciation

Each of your seven field people brought in $281,054 over the last 12 months, over the well-run band. Each truck carries $19,887 a year of overhead.

Sources: Steph's Books HVAC margins. Per truck: ShareWillow (observations from 200-plus shops); Leach, ACHR News 2013 ($200K per service truck).

Open jobs

On track
Parkview Medical Suites
Rooftop unit replacement · Commercial · bid $108,000
costs still landing
Complete87%
Spent vs budget$62.9K of $72.0K
Projected margin33.3%bid 33.3%
Next invoice#2 · $54,000Nov 26

Tap to close. Cost groups and every line behind this card sit in the monthly report.

Michael Griffin
System replacement · Replacements and installs · bid $13,850
costs still landing
Complete63%
Spent vs budget$5.4K of $8.6K
Projected margin38.0%bid 38.0%
Next invoiceFinal · $9,695Ready to bill

Tap to close. Cost groups and every line behind this card sit in the monthly report.

Spent against budget is cost to date over the job budget. Labor posts at the monthly close.

Bills you owe

On track
Total
$82,327
$17,680 due in the next 14 days
Past due
$11,452
13.9% of what you owe
Equipment distributor · #B17512
due Nov 25
$52,600
Marketing agency · #B17503
due Oct 10
$9,499
Sheet metal subcontractor · #B17514
due Nov 6
$6,400
Equipment distributor · #B17520
due Nov 8
$4,591
Equipment distributor · #B17258
due Oct 18
$4,094
See the numbers as a table
AgeBillsAmount
Current7$70,875
1 to 30 days late3$11,452
31 to 60 days late0$0
61 to 90 days late0$0
Over 90 days late0$0
Total10$82,327

From Housecall Pro

On track
Tech hours booked, last 13 weeks
115%
125% for 90 days is the hire signal (Leach)
Booked work, next 4 weeks
$6,575
scheduled jobs and installs

Your software shows $156,395 for September, your books show $154,555. The difference is two invoices not yet exported.

Ask Frank about a number

Pick the number, ask in your own words. You get a reply by the next business day, and questions never cost extra.

This is a sample shop, so questions here go nowhere. Want this built on your own numbers? Book a call with Frank.
Ask Frank about a number
Sturdy NumbersSturdy NumbersSAMPLE

Monthly report · Help with the big calls (Blueprint)

Gray Heron Heating & Air, September 2026

The report the owner gets after each close, page by page, exactly as it prints. On a phone, pinch to zoom in. The PDF copy sits in the same folder as this file.

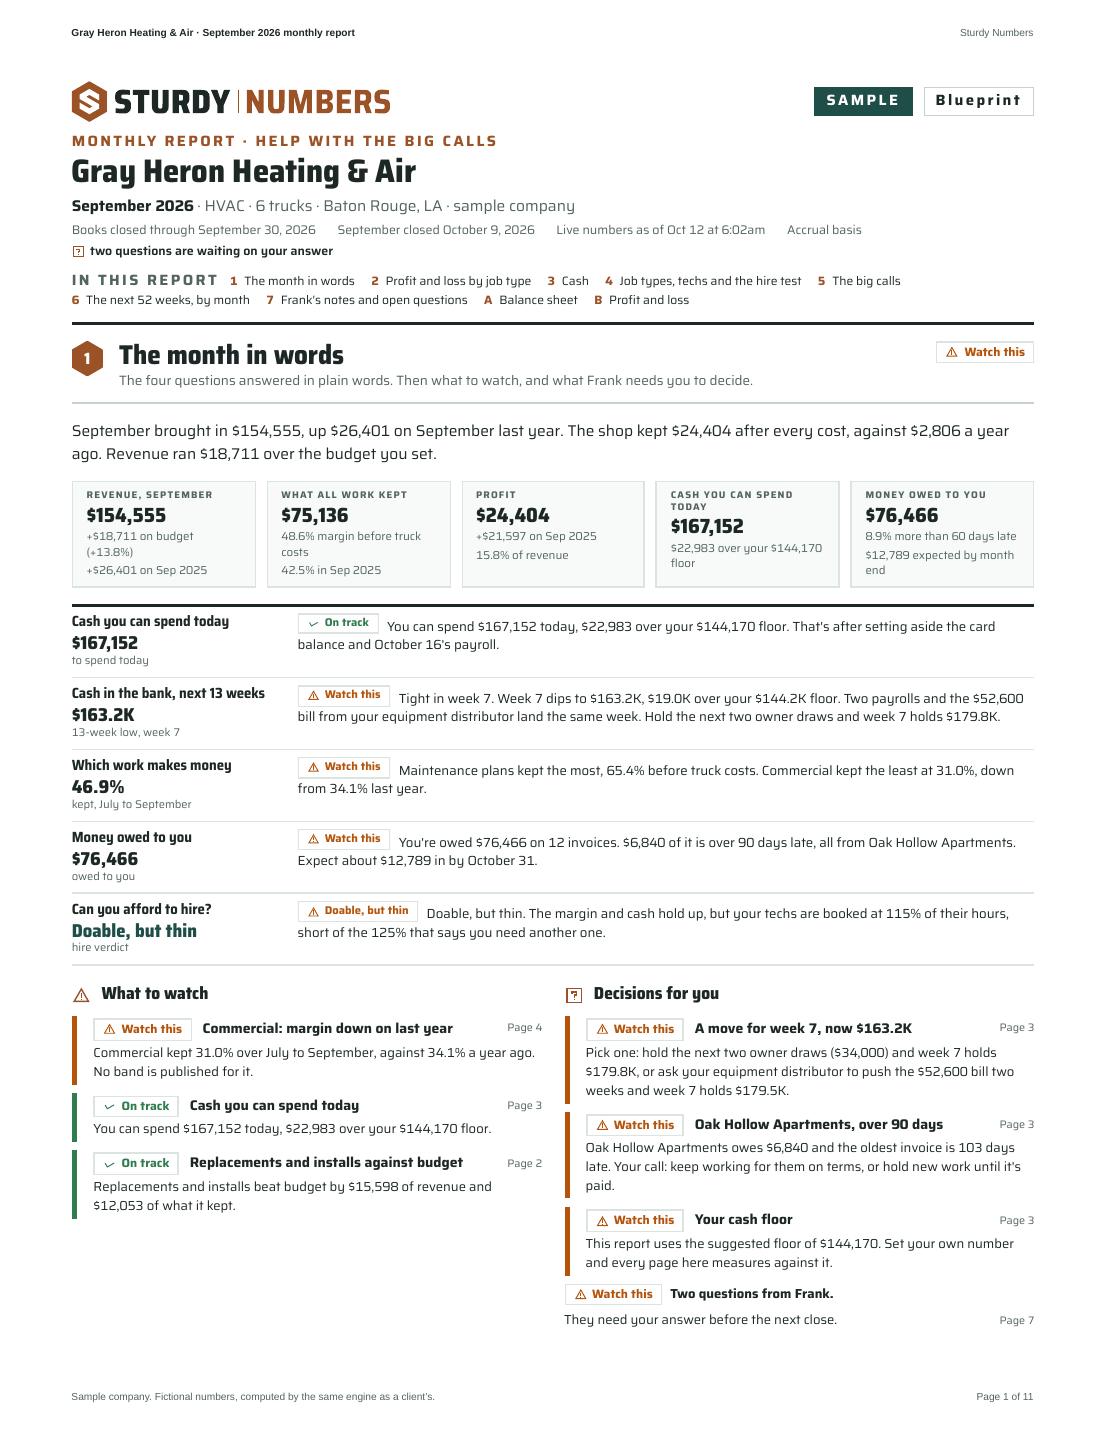
Gray Heron Heating & Air September 2026 monthly report, page 1 of 11
Page 1 of 11
Gray Heron Heating & Air September 2026 monthly report, page 2 of 11
Page 2 of 11
Gray Heron Heating & Air September 2026 monthly report, page 3 of 11
Page 3 of 11
Gray Heron Heating & Air September 2026 monthly report, page 4 of 11
Page 4 of 11
Gray Heron Heating & Air September 2026 monthly report, page 5 of 11
Page 5 of 11
Gray Heron Heating & Air September 2026 monthly report, page 6 of 11
Page 6 of 11
Gray Heron Heating & Air September 2026 monthly report, page 7 of 11
Page 7 of 11
Gray Heron Heating & Air September 2026 monthly report, page 8 of 11
Page 8 of 11
Gray Heron Heating & Air September 2026 monthly report, page 9 of 11
Page 9 of 11
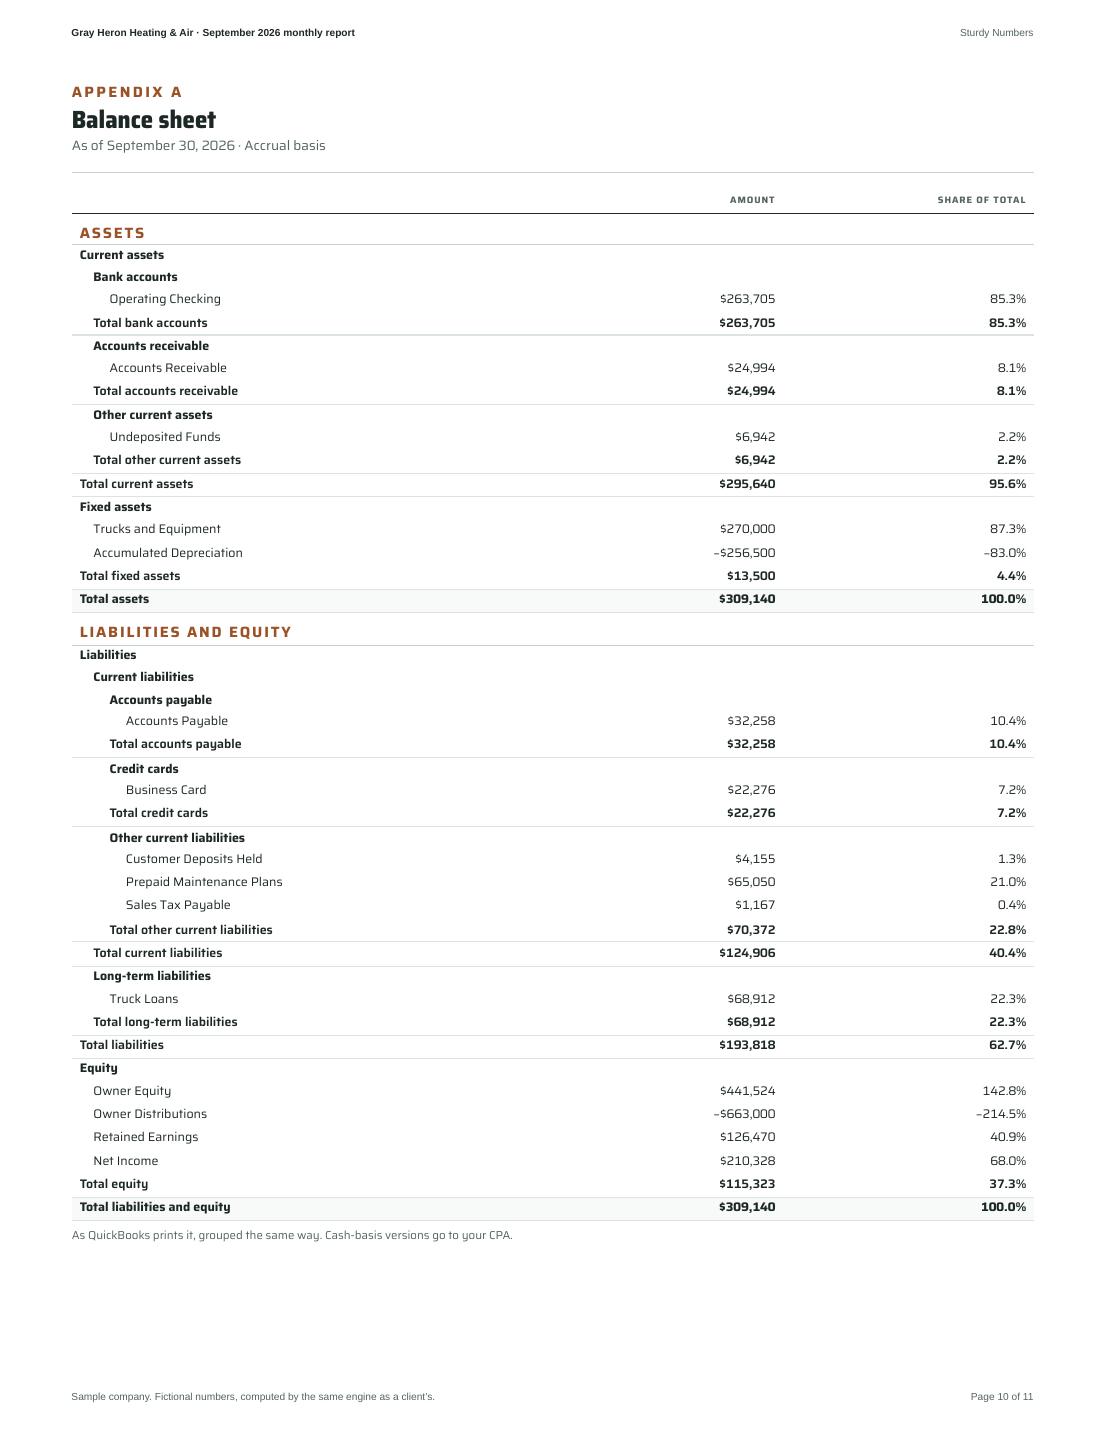
Gray Heron Heating & Air September 2026 monthly report, page 10 of 11
Page 10 of 11
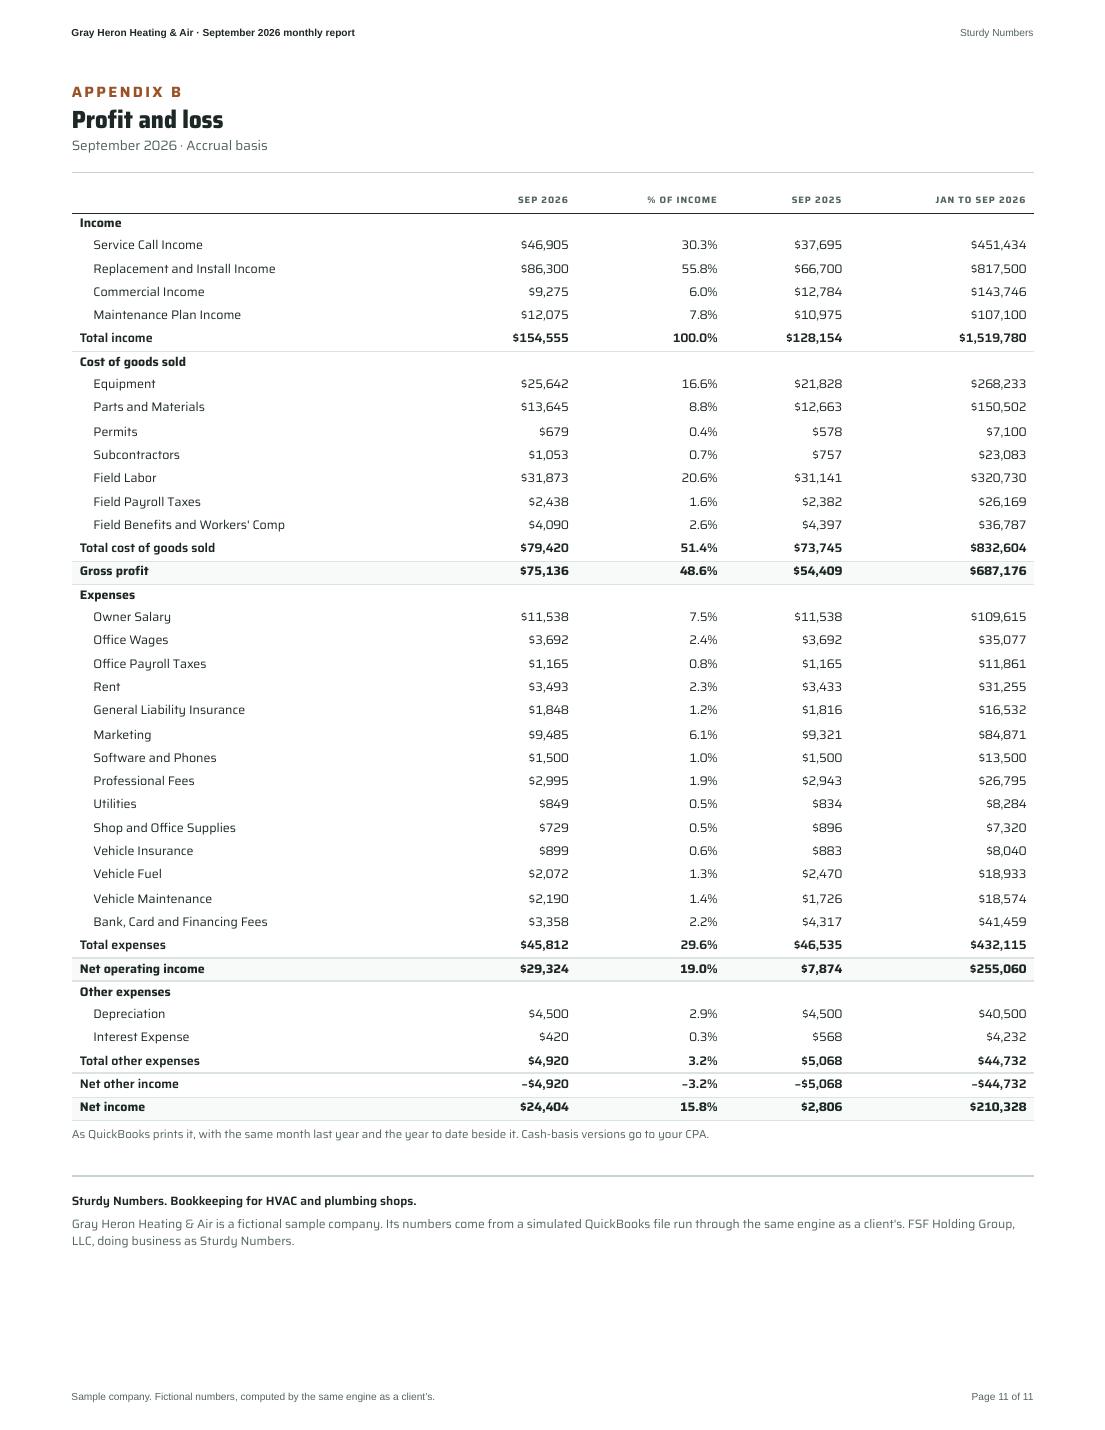
Gray Heron Heating & Air September 2026 monthly report, page 11 of 11
Page 11 of 11