Your four questions and the hire test
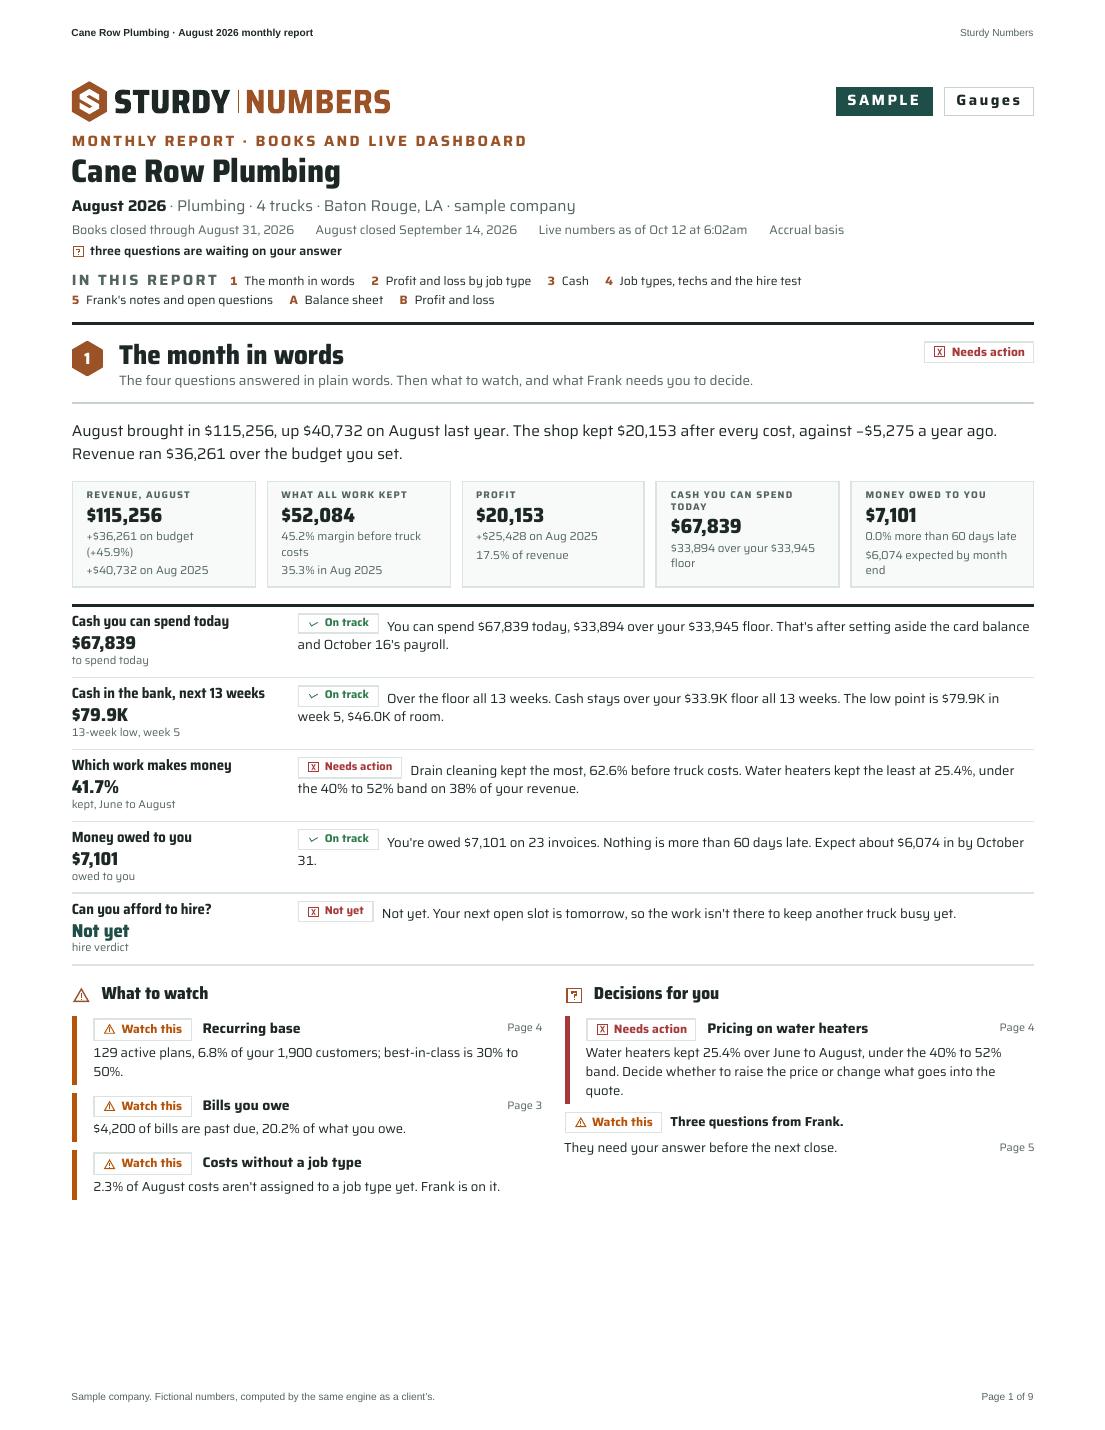
Read top to bottom: cash now, cash ahead, which work pays, who owes you, then whether you can add a tech.
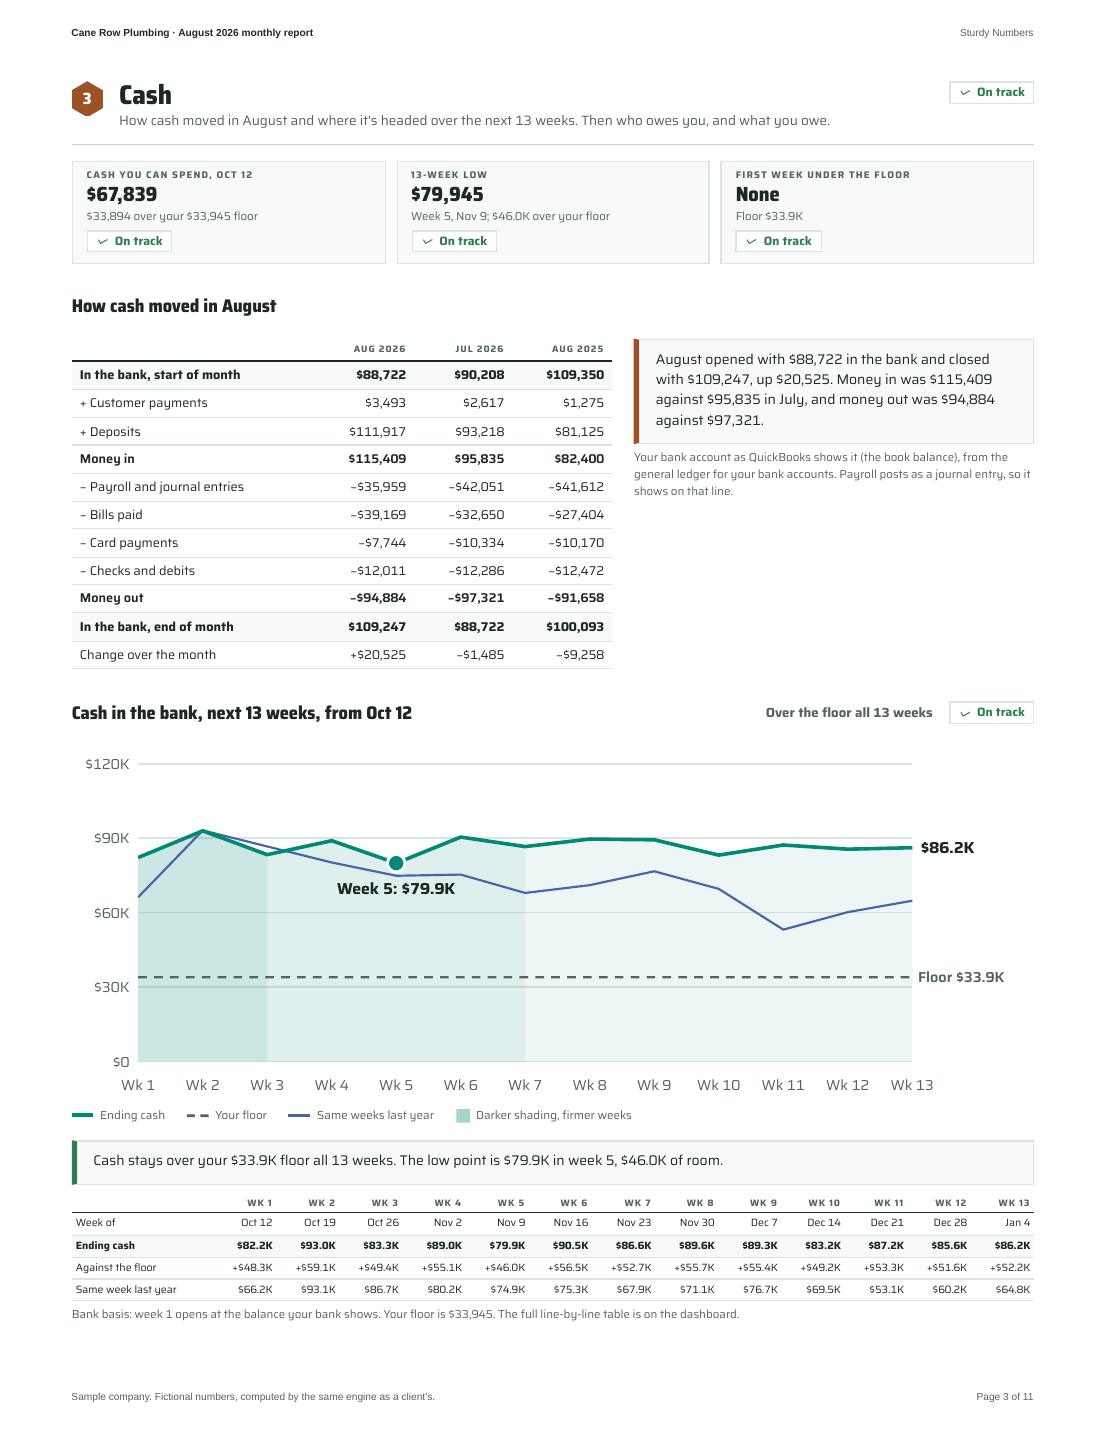
Cash you can spend today
What's yours to spend once you set aside what you already owe.
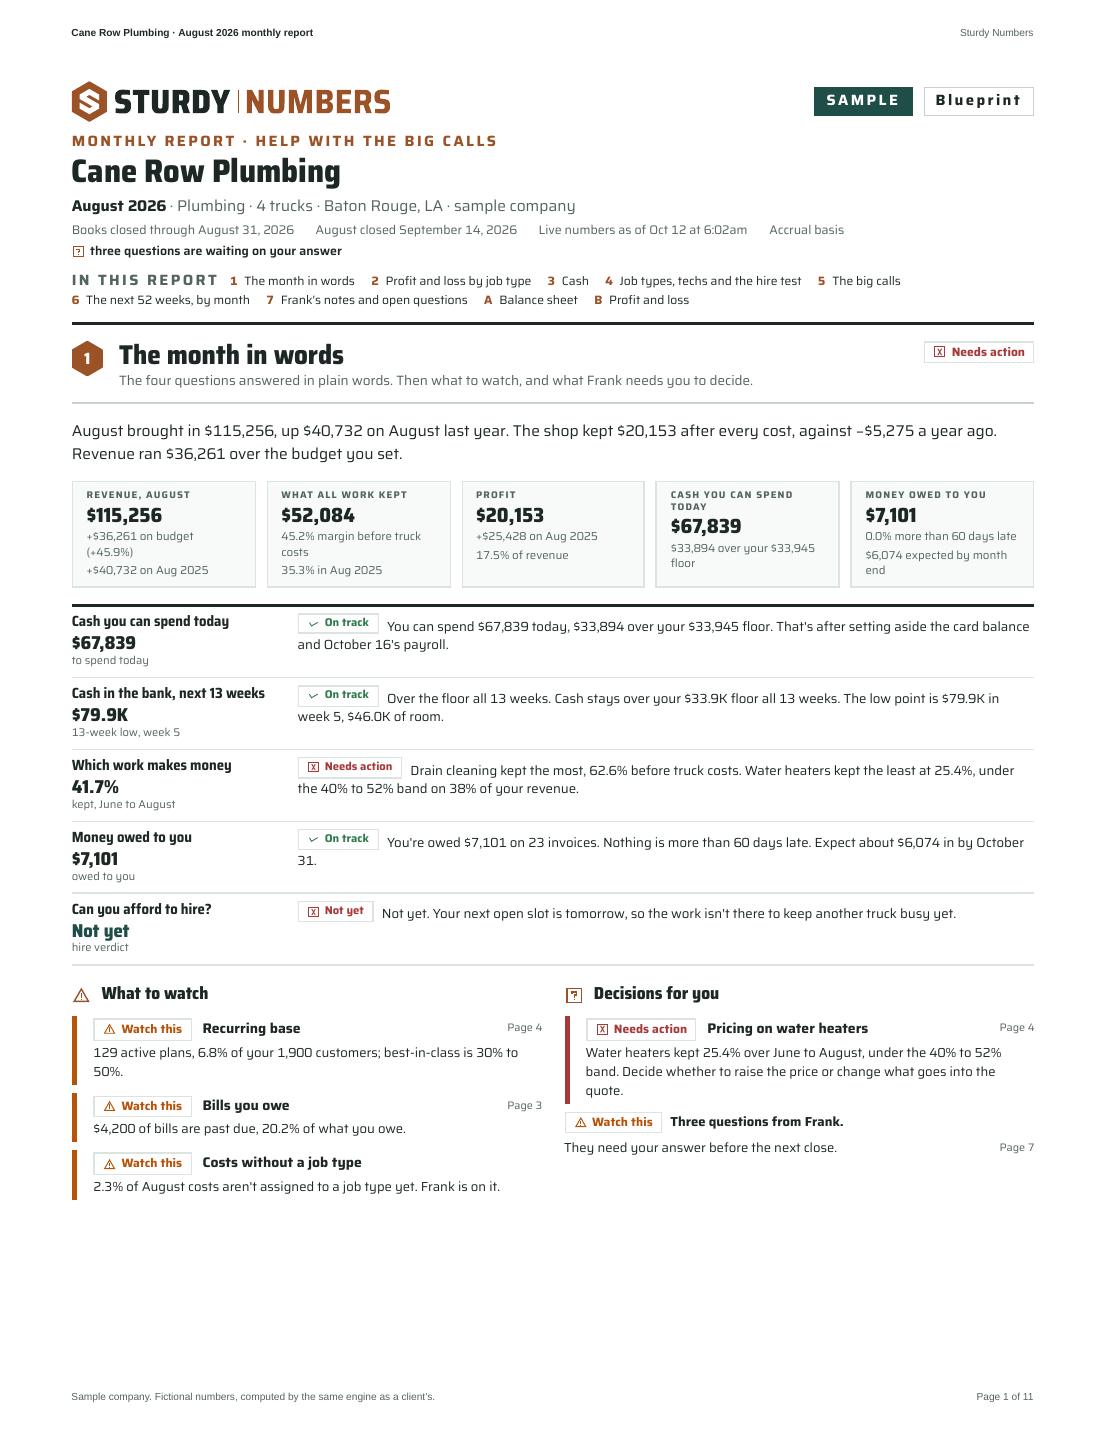
$33,894 over your $33,945 floor
Uncleared items: $1,709 in checks your bank hasn't paid yet. Your bank shows $93,554.
You can spend $67,839 today, $33,894 over your $33,945 floor. That's after setting aside the card balance and October 16's payroll.
See the numbers as a table
| Piece | Amount |
|---|---|
| In the bank (your books) | $91,845 |
| Received, not yet deposited | $6,657 |
| Customer deposits you’re holding | −$2,820 |
| Card balance due | −$14,758 |
| Sales tax owed | −$1,222 |
| Next payroll, Oct 16 | −$11,862 |
| Cash you can spend | $67,839 |
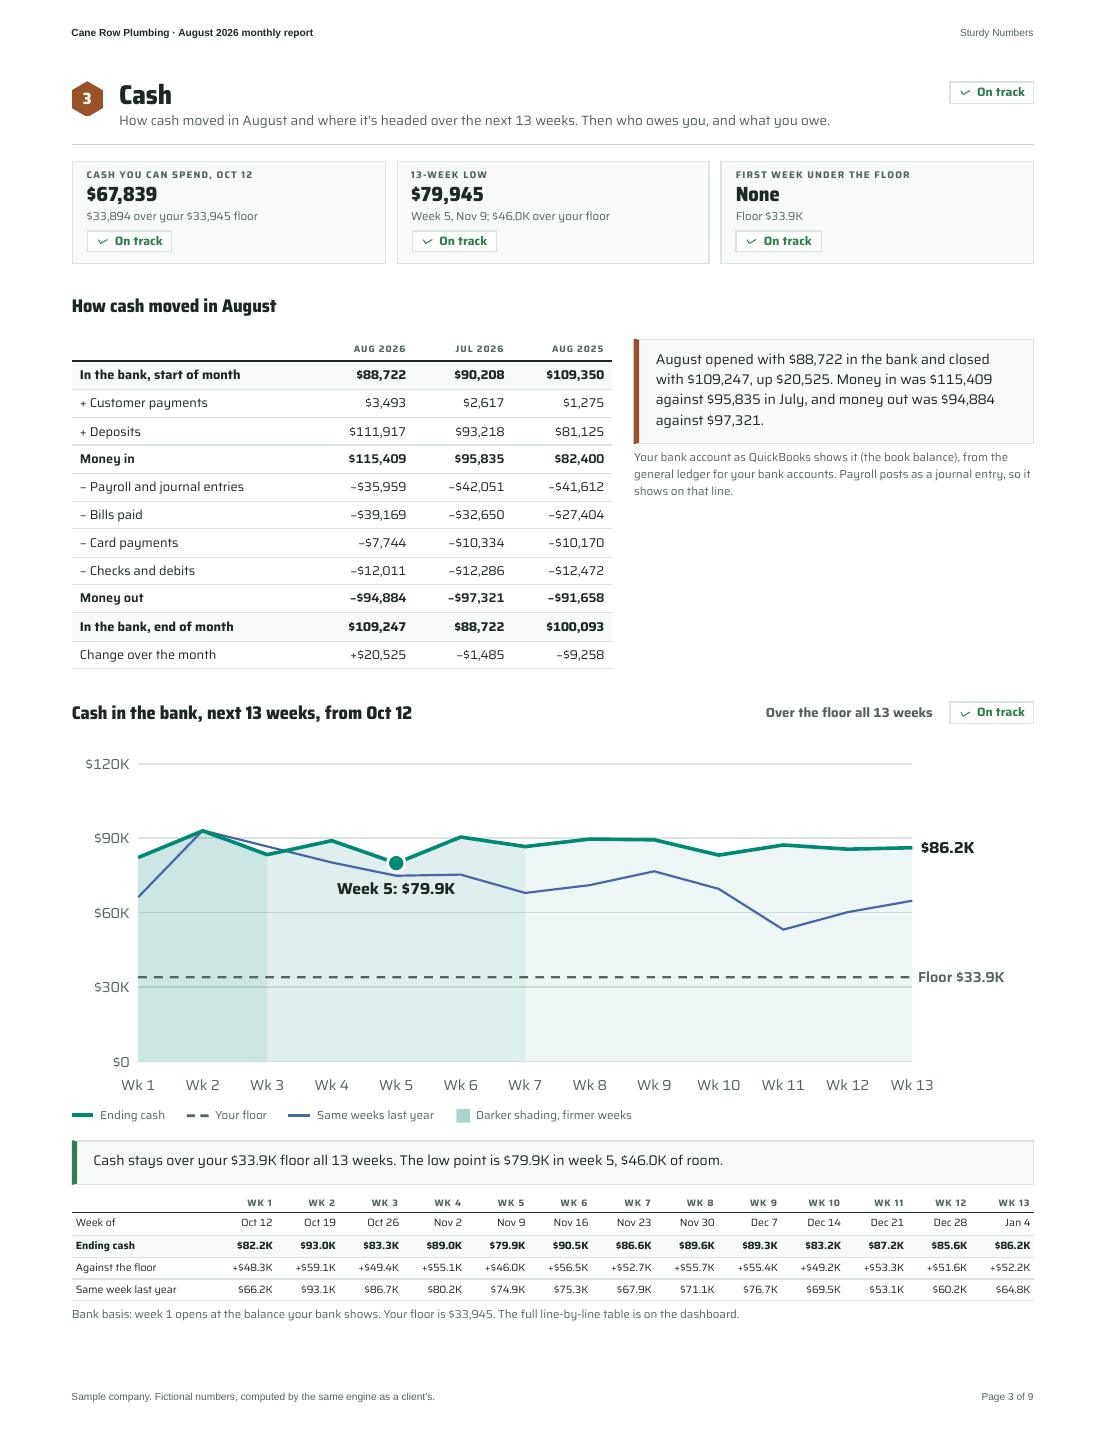
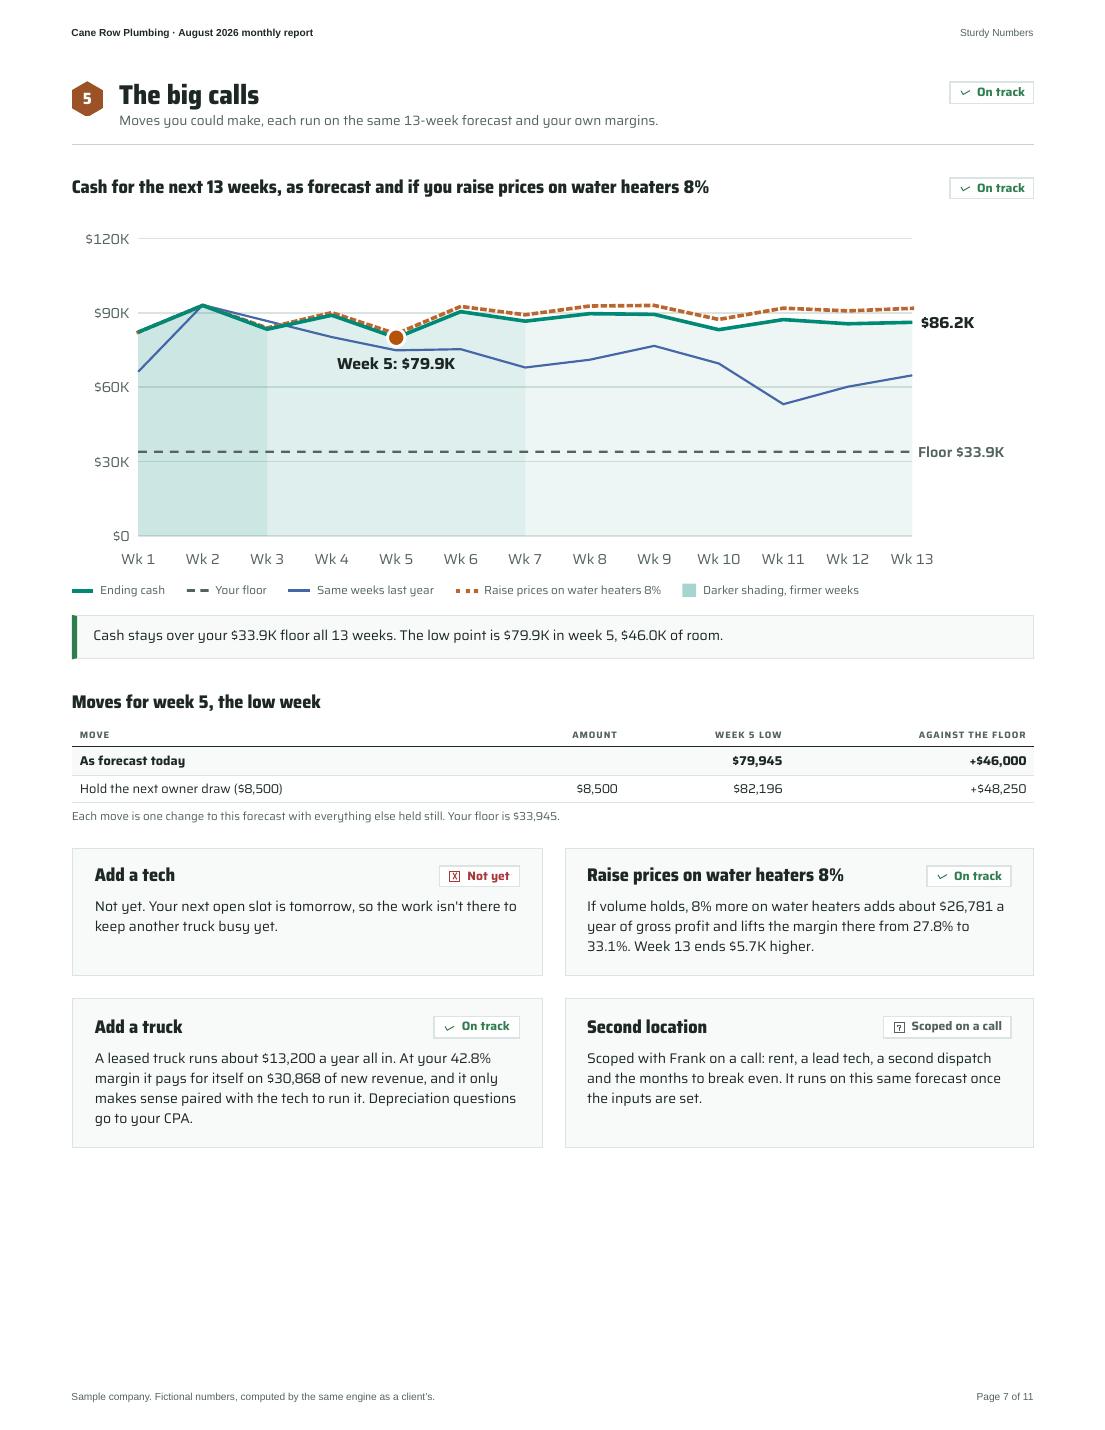
Cash in the bank, next 13 weeks
Where cash is headed, week by week. Tight weeks show up here before they show up at payroll.
Cash stays over your $33.9K floor all 13 weeks. The low point is $79.9K in week 5, $46.0K of room.
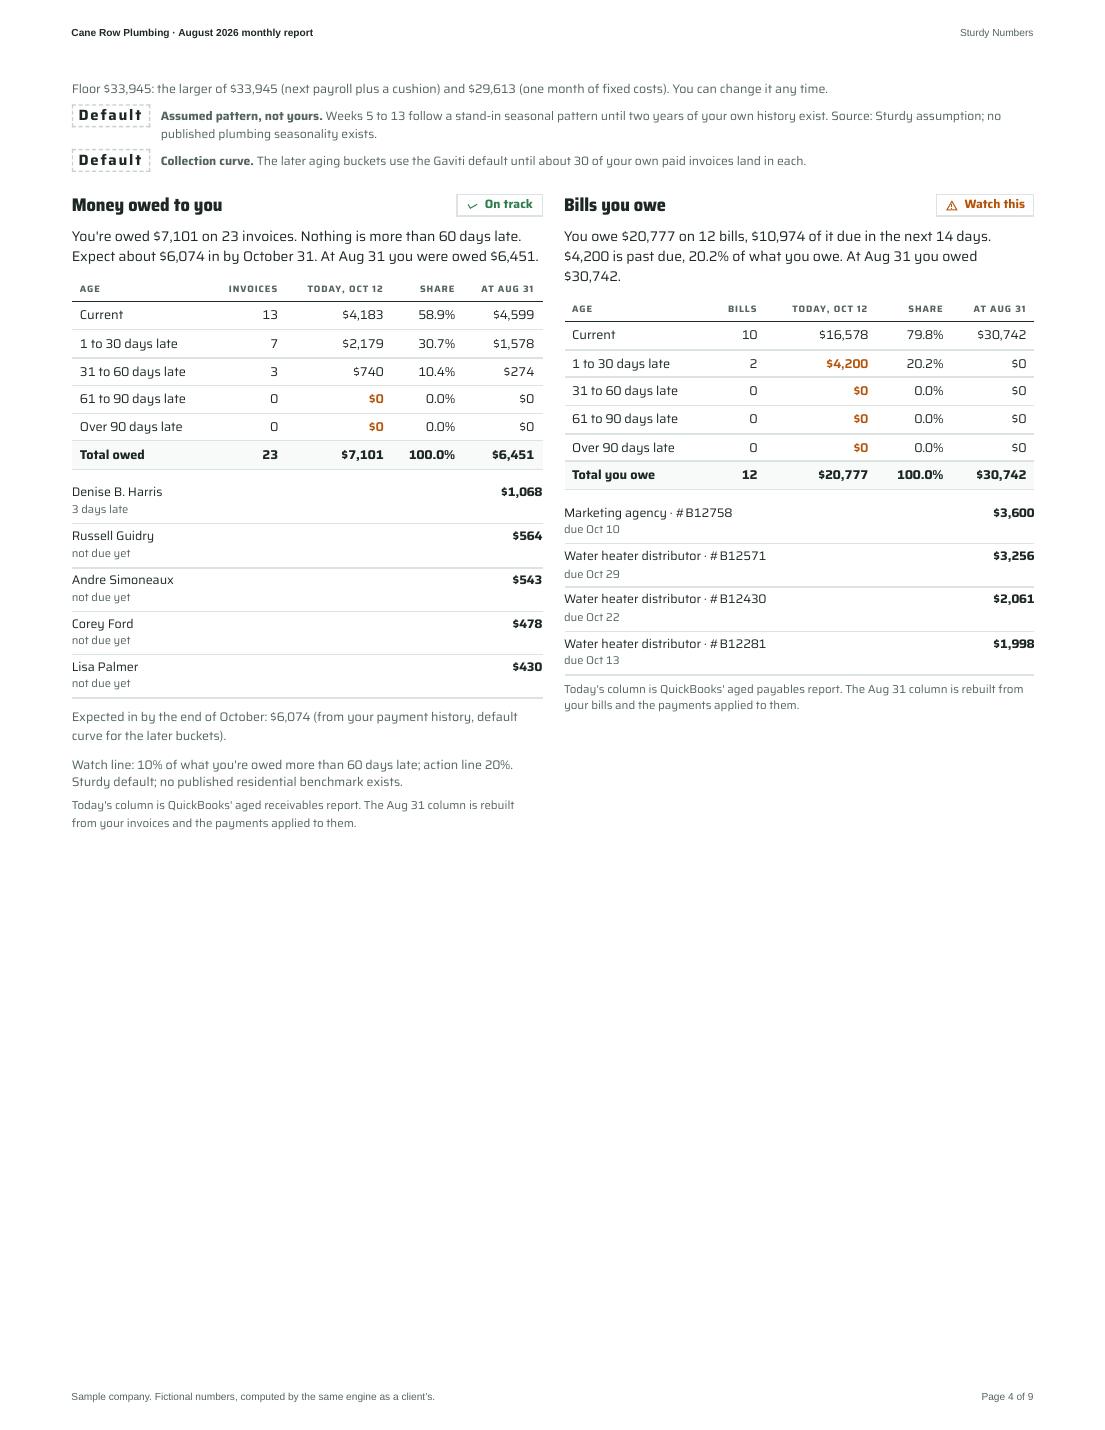
Floor $33,945: the larger of $33,945 (next payroll plus a cushion) and $29,613 (one month of fixed costs). You can change it any time.
Reliability not yet measured. It shows up after 10 weekly cycles; this file has six.
DefaultAssumed pattern, not yours. Weeks 5 to 13 follow a stand-in seasonal pattern until two years of your own history exist. Source: Sturdy assumption; no published plumbing seasonality exists.
DefaultCollection curve. The later aging buckets use the Gaviti default until about 30 of your own paid invoices land in each.
Shading darkens with confidence: weeks 1 and 2 come from scheduled items, 3 to 6 from approved bills and booked work, 7 to 13 from your seasonal pattern.
See the numbers as a table
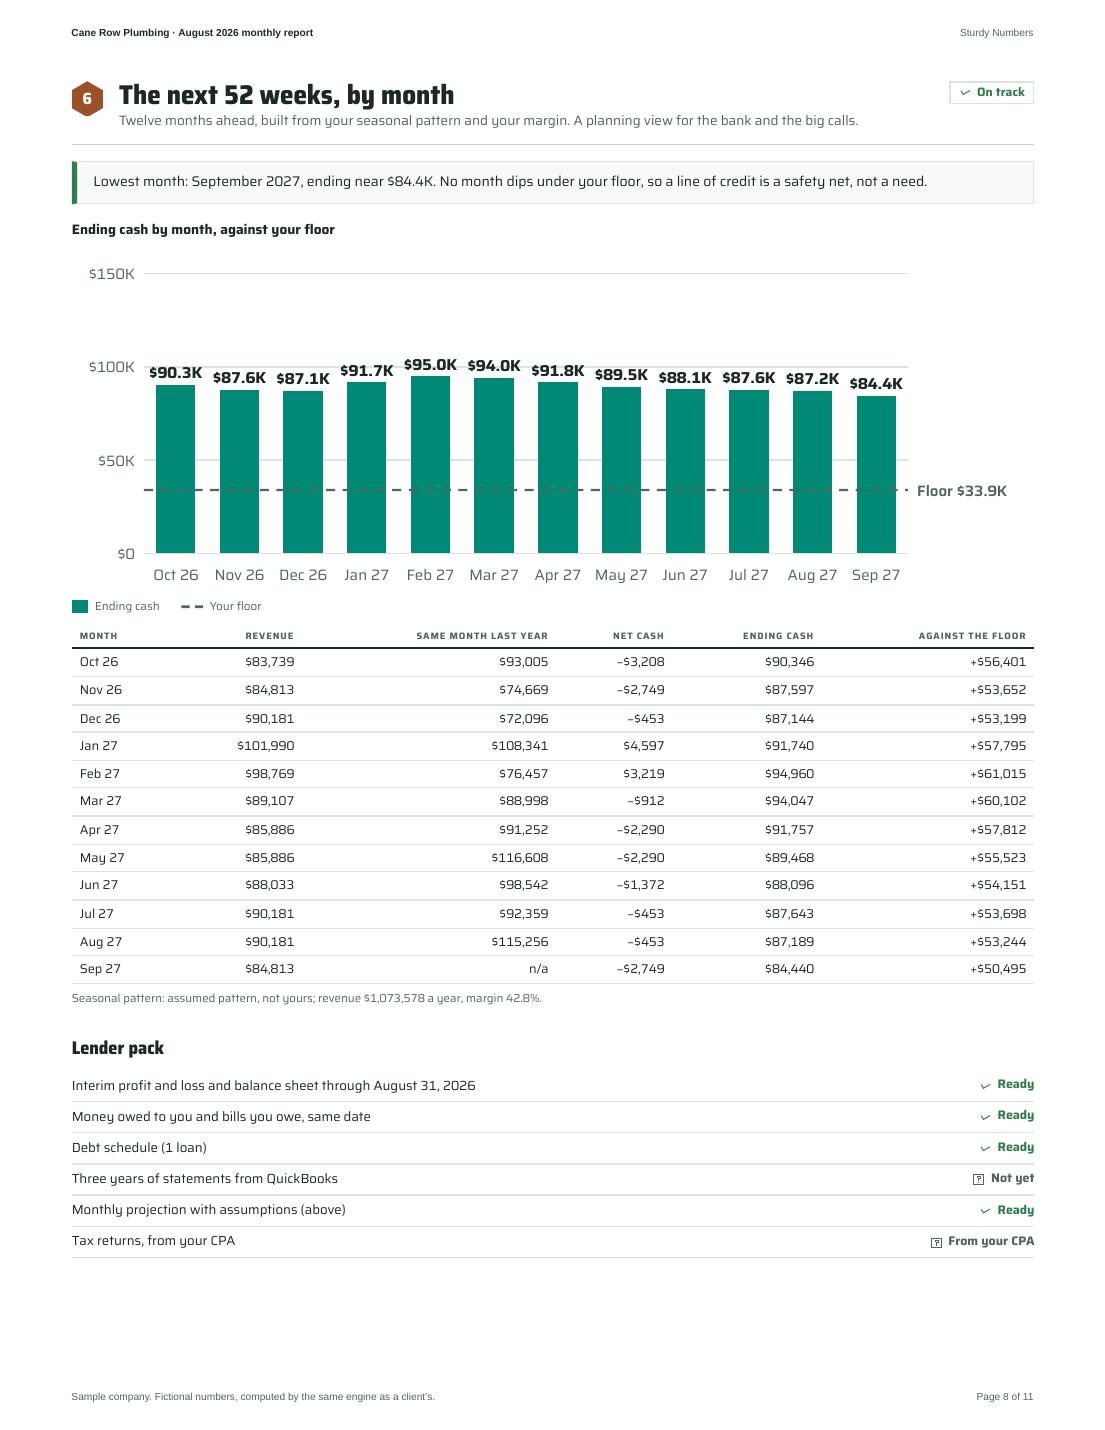
| Line | Wk 1 | Wk 2 | Wk 3 | Wk 4 | Wk 5 | Wk 6 | Wk 7 | Wk 8 | Wk 9 | Wk 10 | Wk 11 | Wk 12 | Wk 13 |
|---|---|---|---|---|---|---|---|---|---|---|---|---|---|
| Week starting | Oct 12 | Oct 19 | Oct 26 | Nov 2 | Nov 9 | Nov 16 | Nov 23 | Nov 30 | Dec 7 | Dec 14 | Dec 21 | Dec 28 | Jan 4 |
| Opening cash (bank) | $93,554 | $82,196 | $92,996 | $83,349 | $89,038 | $79,945 | $90,488 | $86,624 | $89,637 | $89,340 | $83,192 | $87,248 | $85,592 |
| + Deposits on the way and received, not deposited | $6,657 | $0 | $0 | $0 | $0 | $0 | $0 | $0 | $0 | $0 | $0 | $0 | $0 |
| + Collections on money owed to you | $1,889 | $2,399 | $2,083 | $730 | $0 | $0 | $0 | $0 | $0 | $0 | $0 | $0 | $0 |
| + Booked work (accepted estimates) | $5,922 | $0 | $0 | $0 | $0 | $0 | $0 | $0 | $0 | $0 | $0 | $0 | $0 |
| + Maintenance plan renewals | $159 | $478 | $0 | $318 | $159 | $478 | $0 | $796 | $318 | $318 | $318 | $159 | $159 |
| + Financing company payouts | $619 | $0 | $0 | $0 | $0 | $0 | $0 | $0 | $0 | $0 | $0 | $0 | $0 |
| + Work not booked yet (assumed pattern, not yours) | $10,900 | $17,854 | $19,069 | $20,193 | $20,193 | $20,178 | $20,175 | $19,719 | $19,604 | $19,634 | $19,753 | $20,659 | $24,283 |
| − Payroll with employer taxes | $11,862 | $6,148 | $11,862 | $6,148 | $11,862 | $6,148 | $11,862 | $6,148 | $11,862 | $6,148 | $11,862 | $6,148 | $11,862 |
| − Checks written, not cleared yet | $1,709 | $0 | $0 | $0 | $0 | $0 | $0 | $0 | $0 | $0 | $0 | $0 | $0 |
| − Owner draws (your call) | $0 | $0 | $8,500 | $0 | $0 | $0 | $8,500 | $0 | $0 | $0 | $0 | $8,500 | $0 |
| − Bills you owe, by due date | $7,243 | $2,061 | $6,764 | $3,299 | $1,410 | $0 | $0 | $0 | $0 | $0 | $0 | $0 | $0 |
| − Rent, insurance and other fixed costs | $1,932 | $500 | $3,673 | $2,850 | $6,132 | $500 | $0 | $6,523 | $4,200 | $2,432 | $0 | $3,673 | $7,050 |
| − Equipment for booked installs | $0 | $0 | $0 | $2,350 | $0 | $0 | $0 | $0 | $0 | $0 | $0 | $0 | $0 |
| − Truck and equipment loans | $0 | $0 | $0 | $905 | $0 | $0 | $0 | $905 | $0 | $0 | $0 | $0 | $905 |
| − Credit card payment | $14,758 | $0 | $0 | $0 | $10,042 | $0 | $0 | $0 | $0 | $10,042 | $0 | $0 | $0 |
| − Sales tax | $0 | $1,222 | $0 | $0 | $0 | $1,222 | $0 | $0 | $0 | $1,222 | $0 | $0 | $0 |
| − Insurance, true-ups and estimates | $0 | $0 | $0 | $0 | $0 | $0 | $0 | $0 | $0 | $2,100 | $0 | $0 | $0 |
| − Parts for work not booked yet | $0 | $0 | $0 | $0 | $0 | $2,244 | $3,676 | $3,926 | $4,158 | $4,158 | $4,154 | $4,154 | $4,060 |
| Ending cash | $82,196 | $92,996 | $83,349 | $89,038 | $79,945 | $90,488 | $86,624 | $89,637 | $89,340 | $83,192 | $87,248 | $85,592 | $86,158 |
| Your floor | $33,945 | $33,945 | $33,945 | $33,945 | $33,945 | $33,945 | $33,945 | $33,945 | $33,945 | $33,945 | $33,945 | $33,945 | $33,945 |
| Same week last year | $66,243 | $93,138 | $86,677 | $80,198 | $74,863 | $75,338 | $67,897 | $71,052 | $76,657 | $69,545 | $53,100 | $60,197 | $64,775 |
| Customer deposits held (in the totals above) | $2,820 | $2,820 | $2,820 | $2,820 | $2,820 | $2,820 | $2,820 | $2,820 | $2,820 | $2,820 | $2,820 | $2,820 | $2,820 |
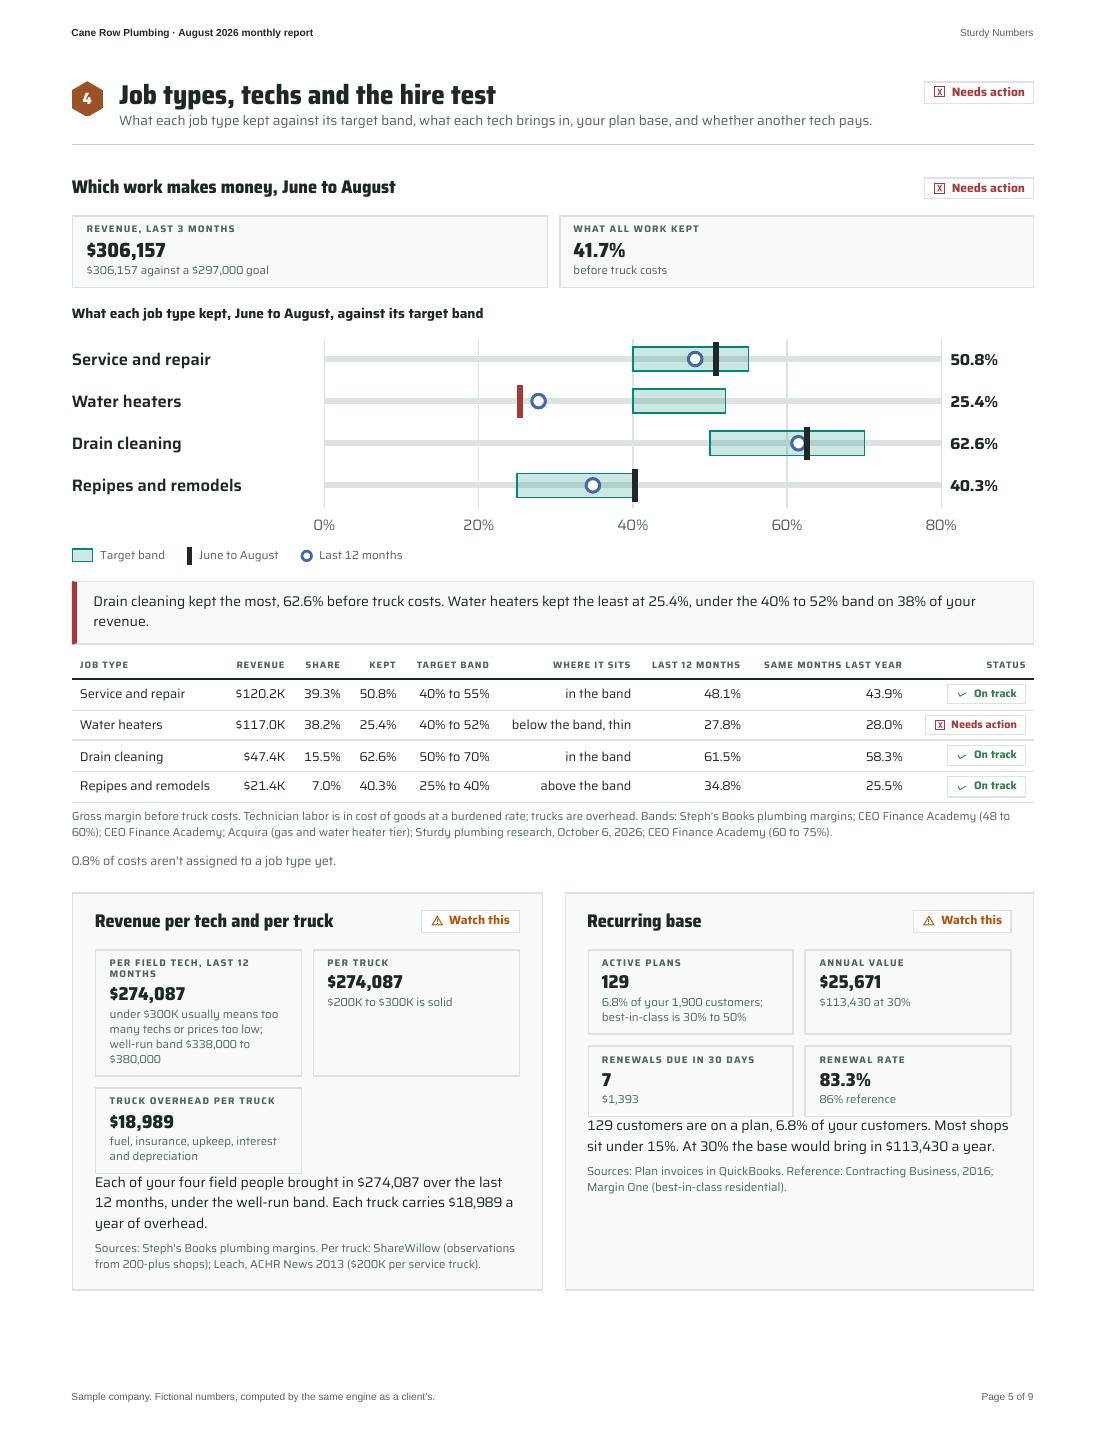
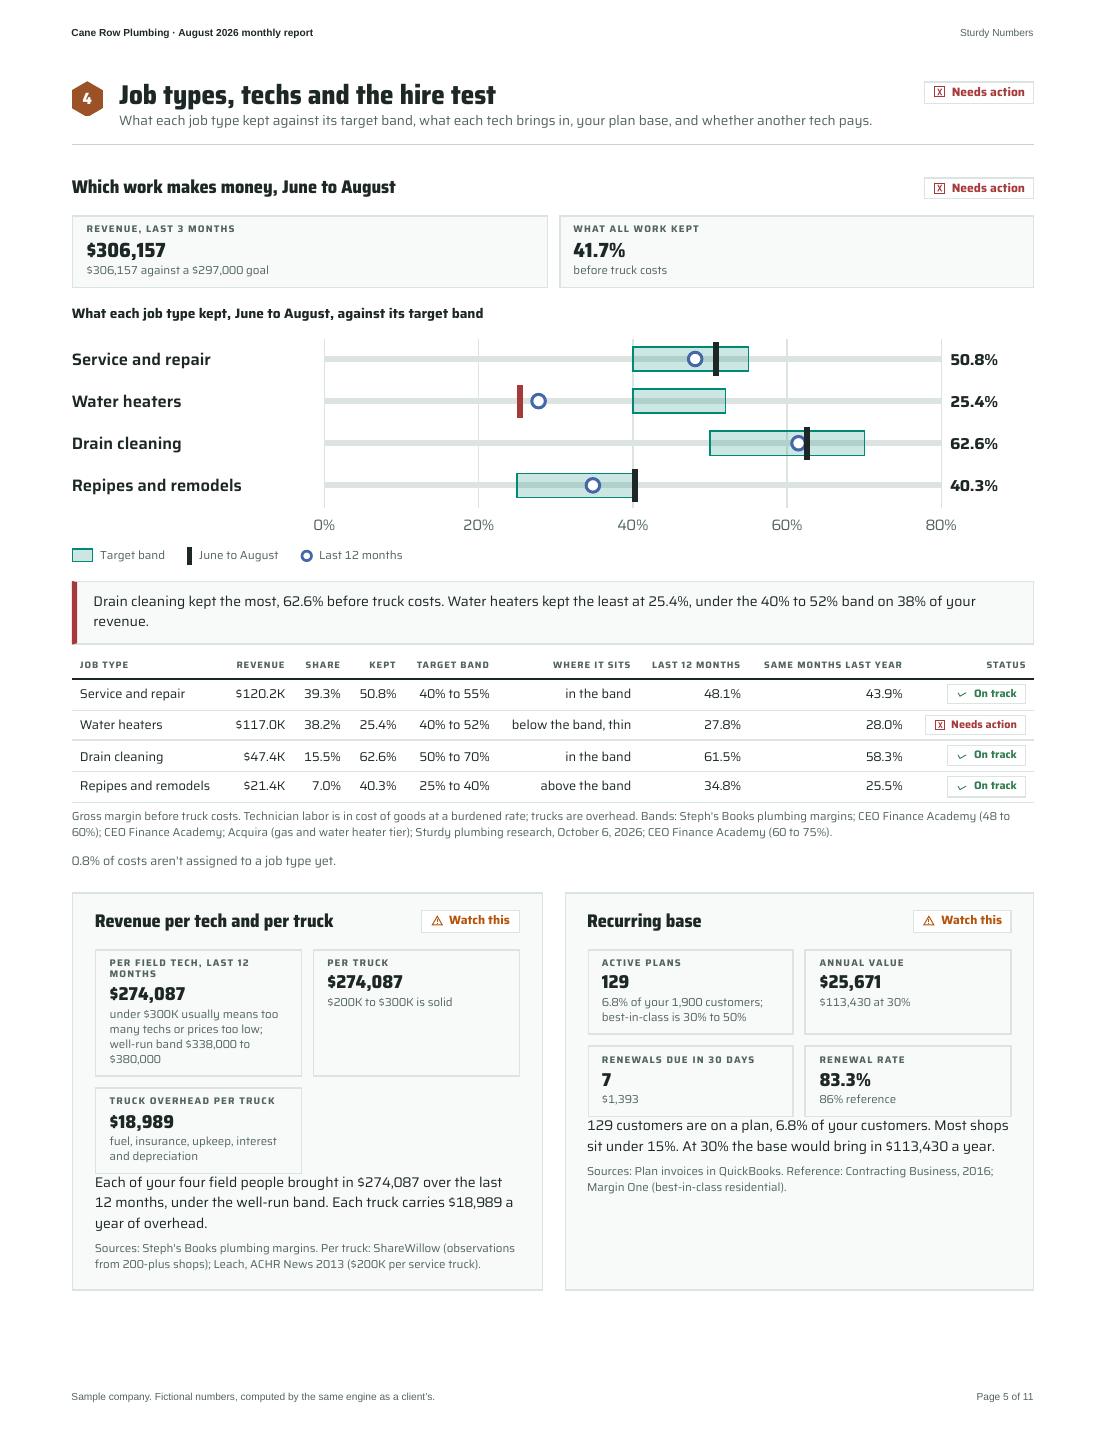
Which work makes money
Revenue and what each type of job kept, before truck costs.
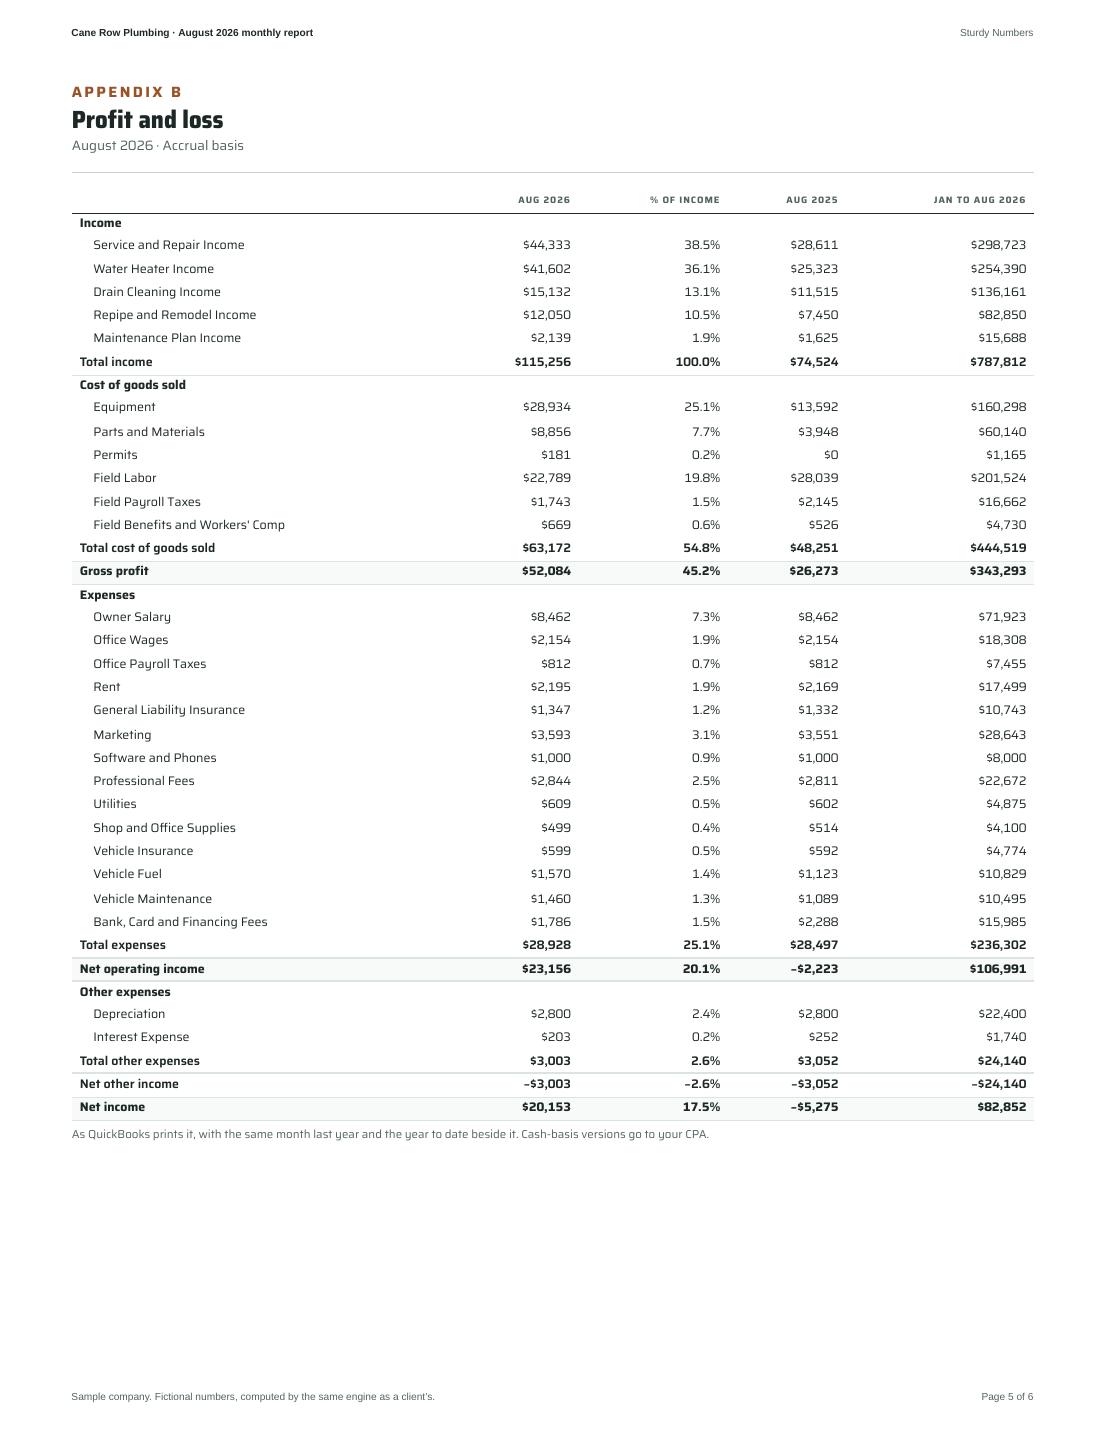
Drain cleaning kept the most, 62.6% before truck costs. Water heaters kept the least at 25.4%, under the 40% to 52% band on 38% of your revenue.
0.8% of costs aren't assigned to a job type yet.
See the numbers as a table
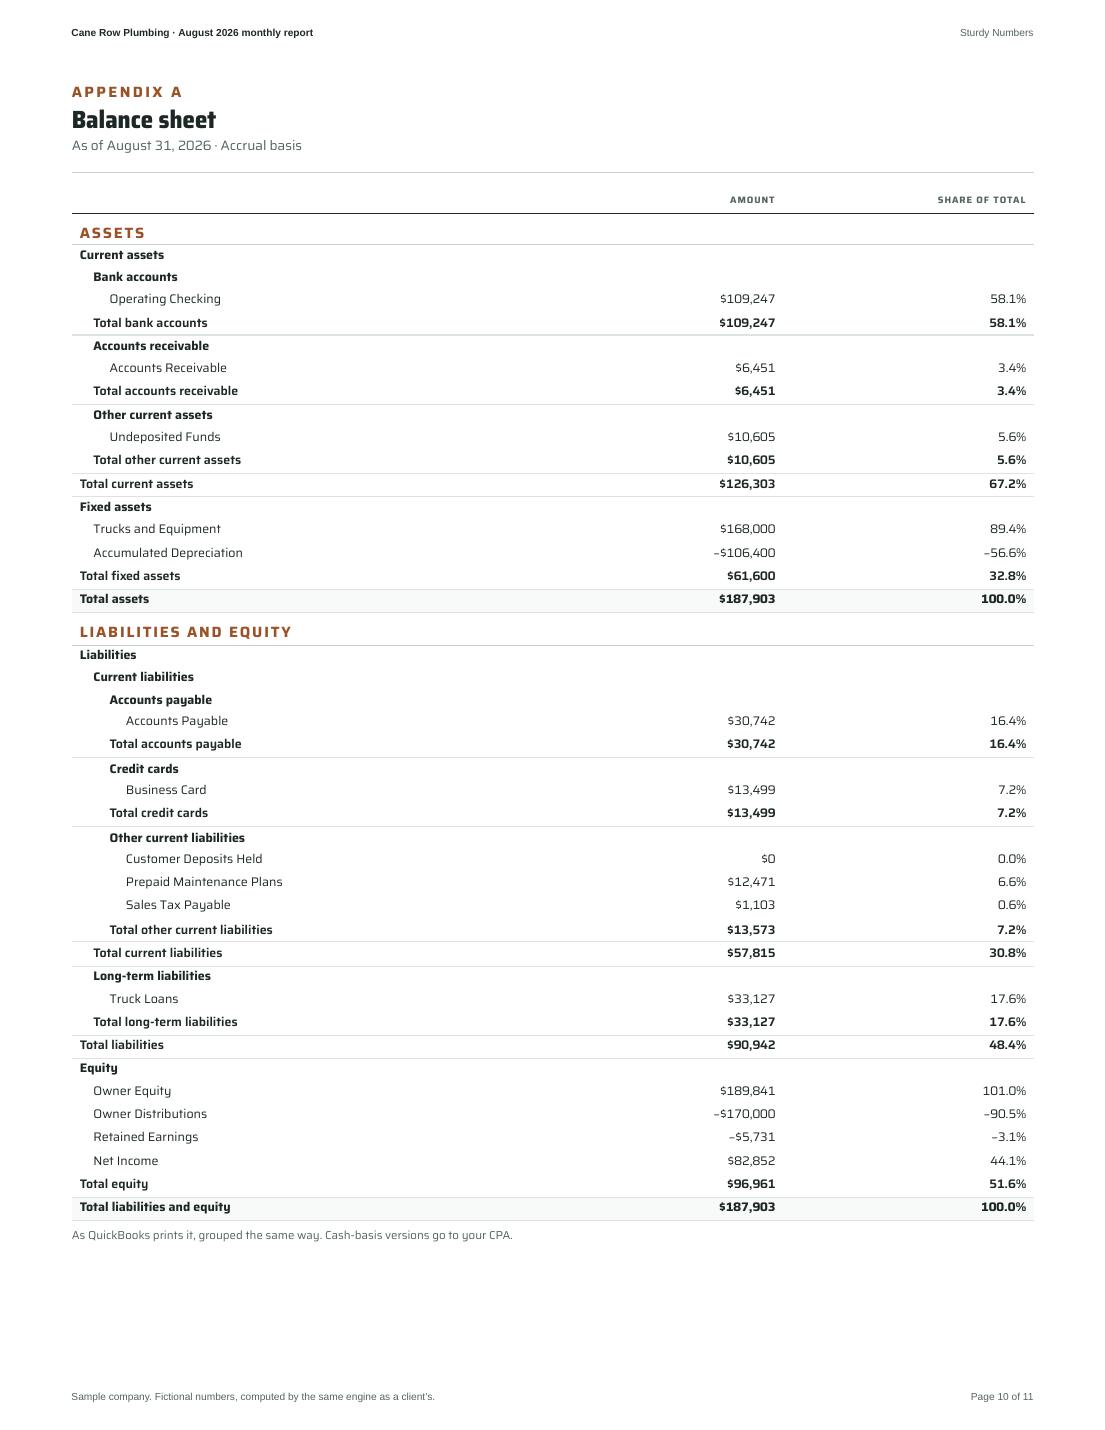
| Job type | Revenue | Share | Cost of goods | Gross profit | Margin | Target band | Last year margin |
|---|---|---|---|---|---|---|---|
| Service and repair | $120,249 | 39.3% | $59,164 | $61,084 | 50.8% | 40% to 55% | 43.9% |
| Water heaters | $117,032 | 38.2% | $87,347 | $29,685 | 25.4% | 40% to 52% | 28.0% |
| Drain cleaning | $47,426 | 15.5% | $17,751 | $29,675 | 62.6% | 50% to 70% | 58.3% |
| Repipes and remodels | $21,450 | 7.0% | $12,802 | $8,648 | 40.3% | 25% to 40% | 25.5% |
| All job types | $306,157 | 100.0% | $178,507 | $127,650 | 41.7% |
June to August, closed months. Bars show revenue; the thin line under each shows what it kept, with the target band shaded.
Drain cleaning kept the most, 61.5% before truck costs. Water heaters kept the least at 27.8%, under the 40% to 52% band on 31% of your revenue.
0.2% of costs aren't assigned to a job type yet.
See the numbers as a table
| Job type | Revenue | Share | Cost of goods | Gross profit | Margin | Target band | Last year margin |
|---|---|---|---|---|---|---|---|
| Service and repair | $446,536 | 40.7% | $231,863 | $214,673 | 48.1% | 40% to 55% | n/a |
| Water heaters | $334,760 | 30.5% | $241,828 | $92,932 | 27.8% | 40% to 52% | n/a |
| Drain cleaning | $198,701 | 18.1% | $76,535 | $122,166 | 61.5% | 50% to 70% | n/a |
| Repipes and remodels | $116,350 | 10.6% | $75,844 | $40,506 | 34.8% | 25% to 40% | n/a |
| All job types | $1,096,347 | 100.0% | $627,513 | $468,834 | 42.8% |
September to August, closed months. Bars show revenue; the thin line under each shows what it kept, with the target band shaded.
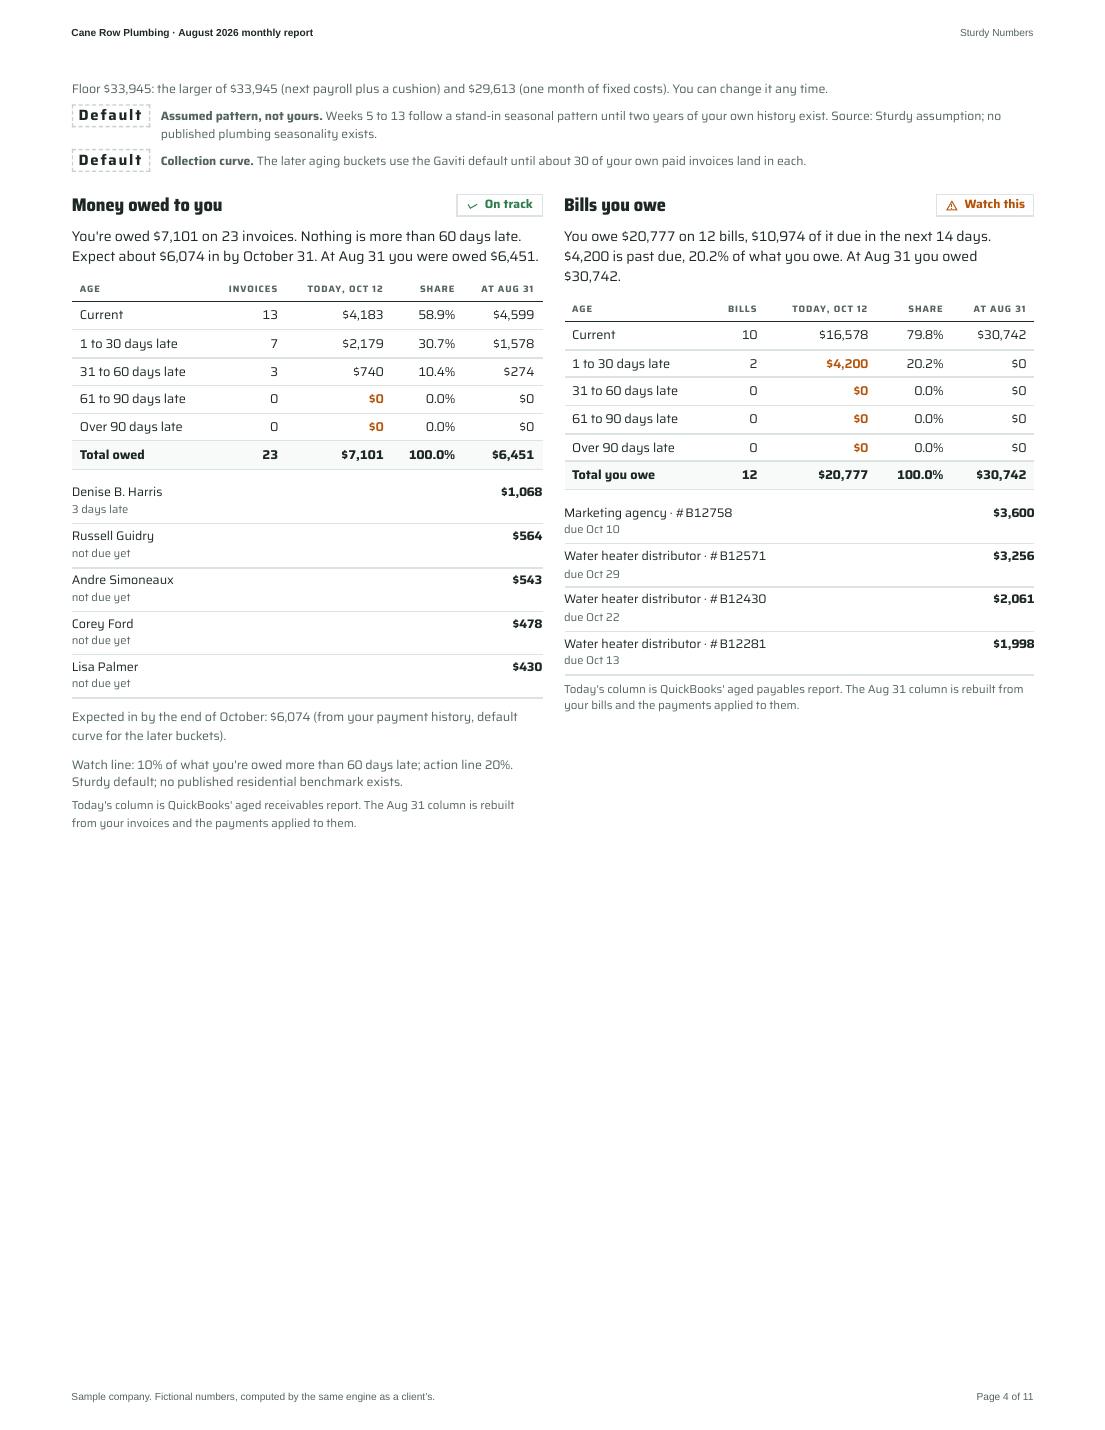
Money owed to you
Unpaid invoices, by how long they're late. Tap a customer to call.
Five biggest balances (sample phone numbers)
3 days late$1,068
not due yet$564
not due yet$543
not due yet$478
not due yet$430
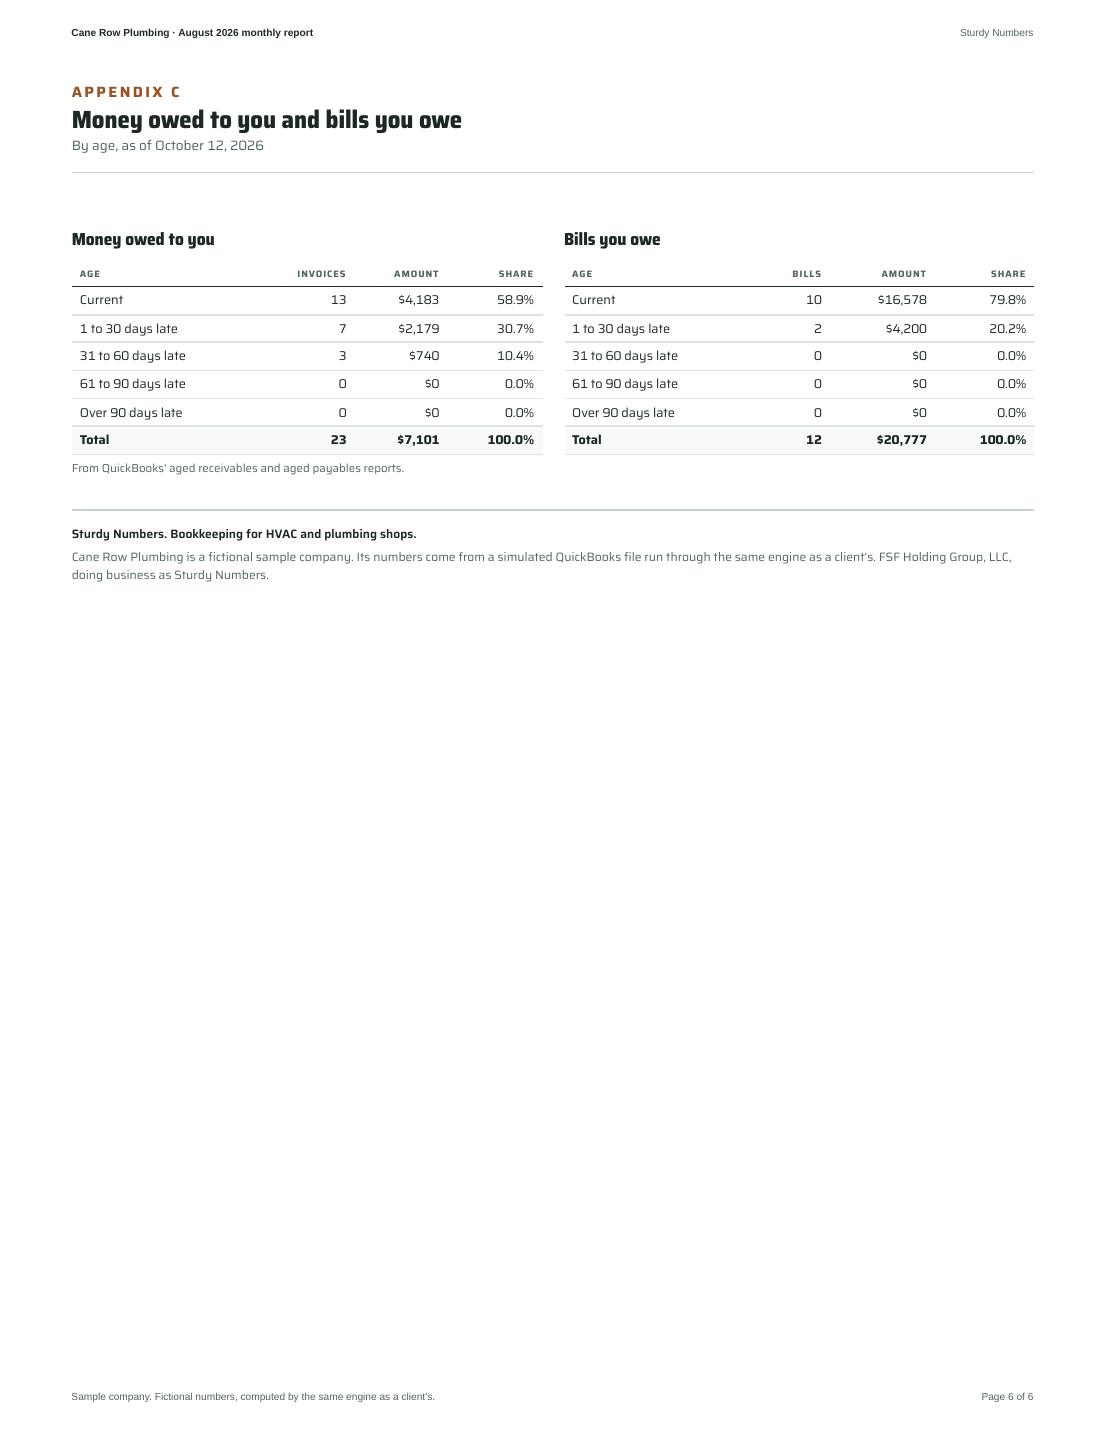
You're owed $7,101 on 23 invoices. Nothing is more than 60 days late. Expect about $6,074 in by October 31.
See the numbers as a table
| Age | Invoices | Amount | Share |
|---|---|---|---|
| Current | 13 | $4,183 | 58.9% |
| 1 to 30 days late | 7 | $2,179 | 30.7% |
| 31 to 60 days late | 3 | $740 | 10.4% |
| 61 to 90 days late | 0 | $0 | 0.0% |
| Over 90 days late | 0 | $0 | 0.0% |
| Total owed | 23 | $7,101 | 100.0% |
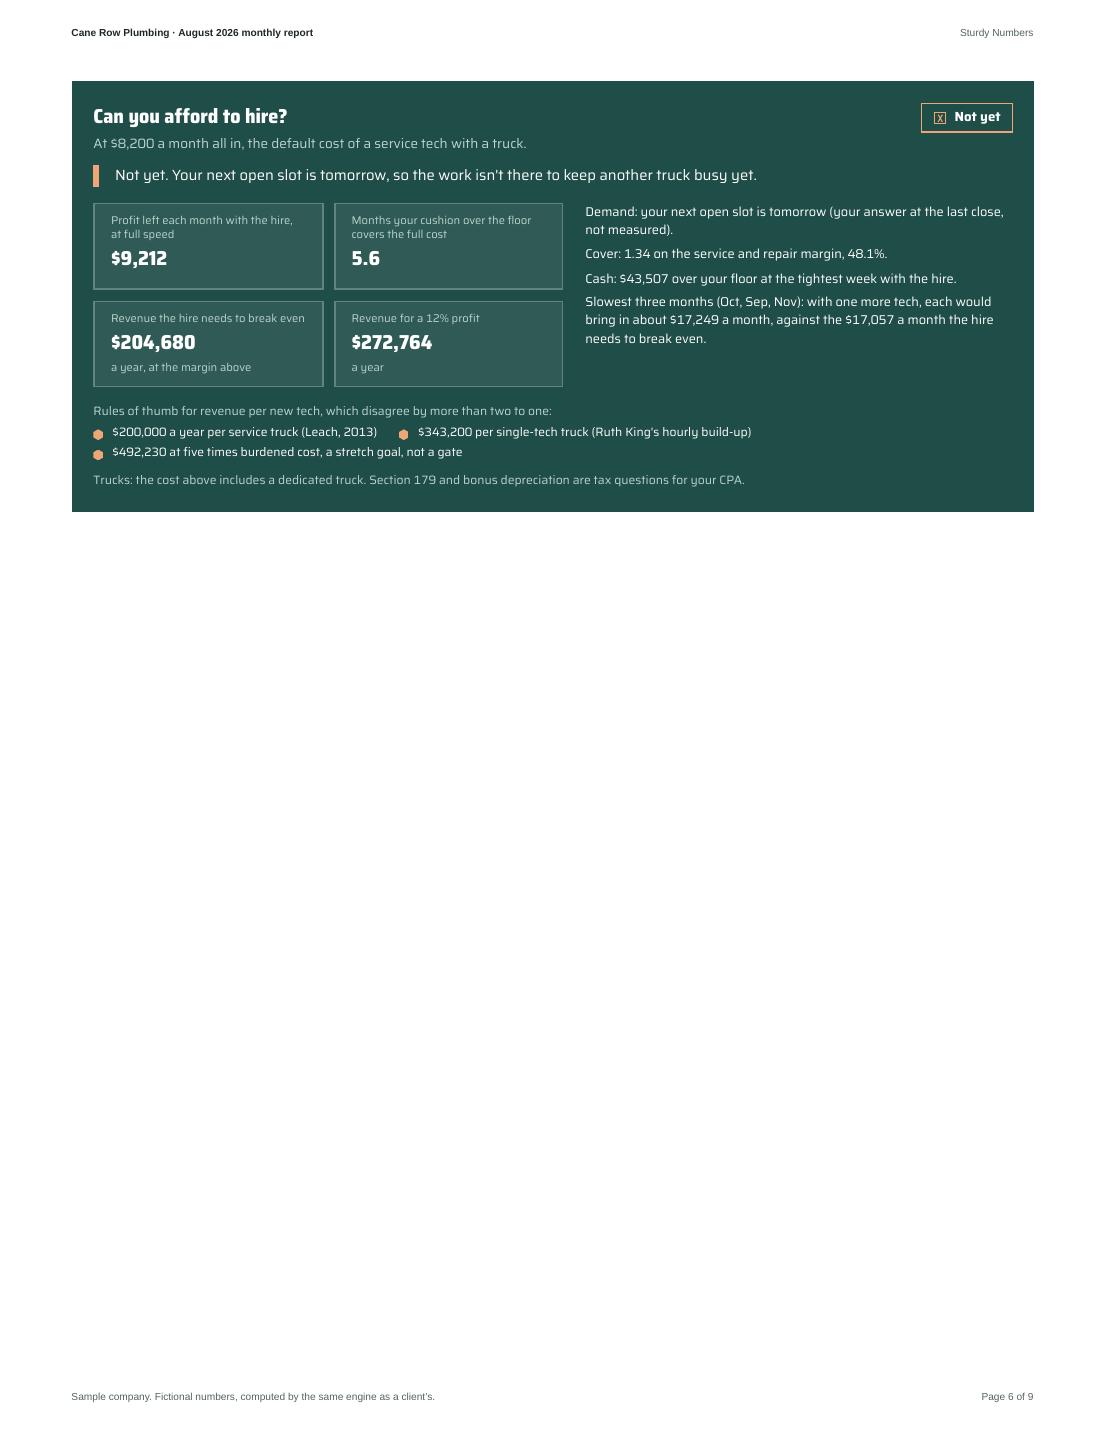
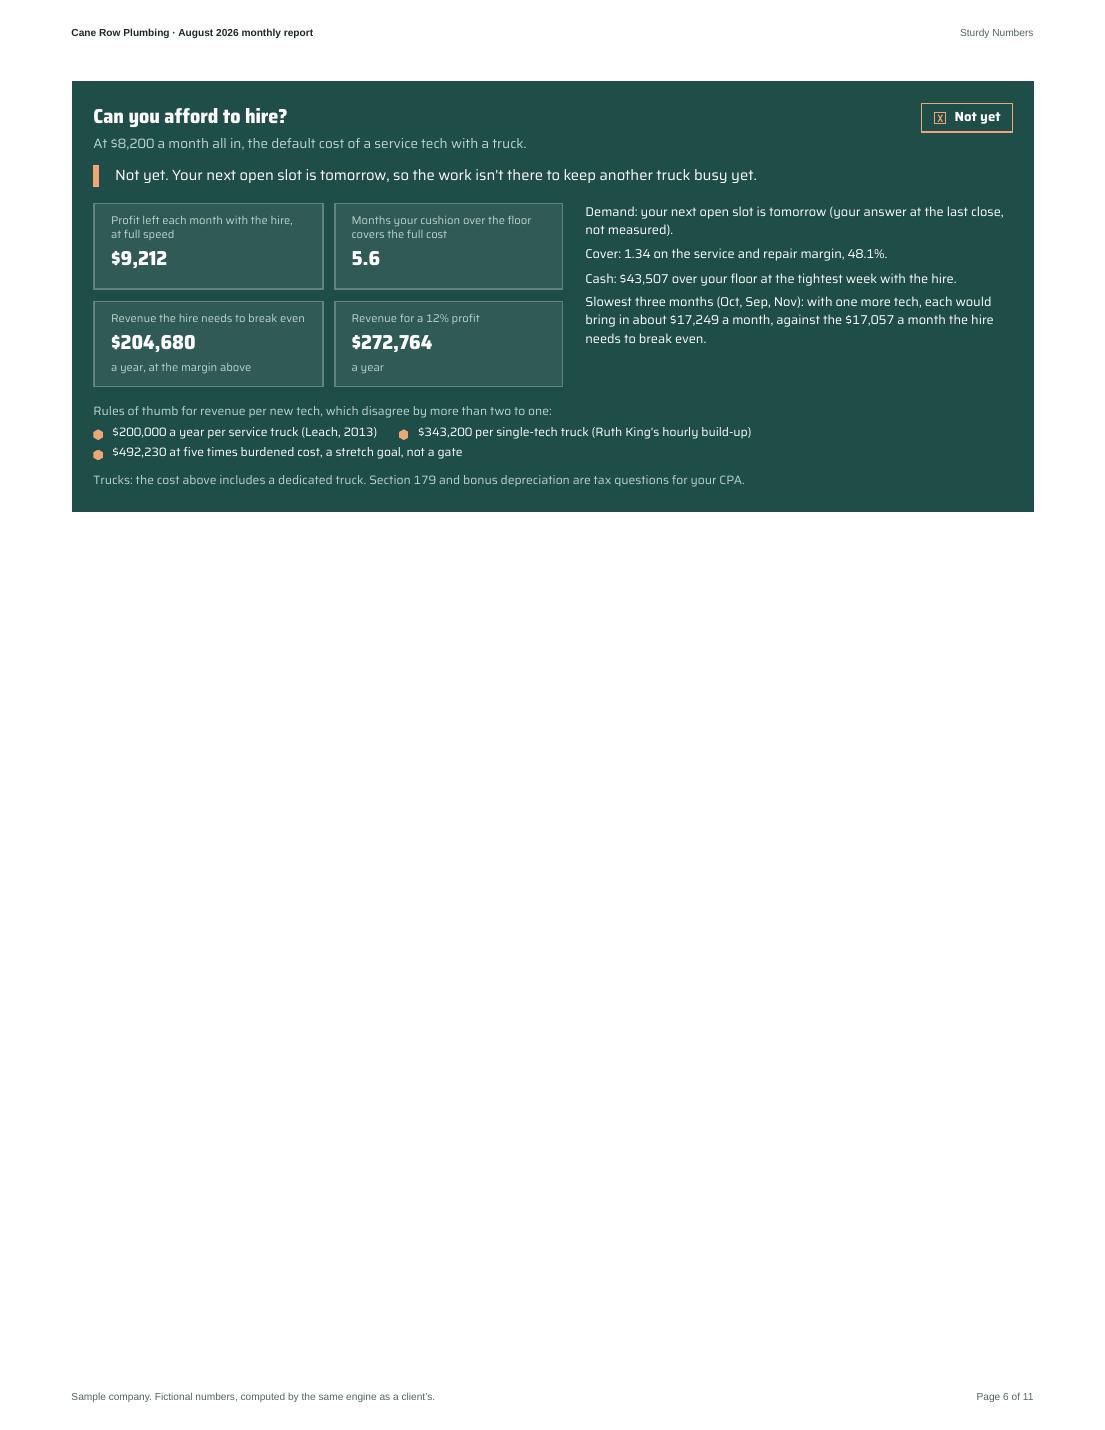
Can you afford to hire?
Set the all-in monthly cost: wage, payroll taxes, insurance, phone and the truck.
Cash with and without the hire
Ending cash for 13 weeks. The dotted line carries the hire's cost while the new tech ramps up.
Demand: your next open slot is tomorrow (your answer at the last close, not measured).
Cover: 1.34 on the service and repair margin, 48.1%.
Cash: $43,507 over your floor at the tightest week with the hire.
Slowest three months (Oct, Sep, Nov): with one more tech, each would bring in about $17,249 a month, against the $17,057 a month the hire needs to break even.
See the numbers as a table
| Week | Without the hire | With the hire | Floor |
|---|---|---|---|
| Wk 1 | $82,196 | $81,571 | $33,945 |
| Wk 2 | $92,996 | $91,745 | $33,945 |
| Wk 3 | $83,349 | $81,473 | $33,945 |
| Wk 4 | $89,038 | $86,537 | $33,945 |
| Wk 5 | $79,945 | $77,452 | $33,945 |
| Wk 6 | $90,488 | $88,003 | $33,945 |
| Wk 7 | $86,624 | $84,147 | $33,945 |
| Wk 8 | $89,637 | $87,168 | $33,945 |
| Wk 9 | $89,340 | $87,513 | $33,945 |
| Wk 10 | $83,192 | $82,007 | $33,945 |
| Wk 11 | $87,248 | $86,705 | $33,945 |
| Wk 12 | $85,592 | $85,690 | $33,945 |
| Wk 13 | $86,158 | $86,898 | $33,945 |
Revenue the hire must produce
Rules of thumb, which disagree by more than two to one:
- $200,000 a year per service truck (Leach, 2013)
- $343,200 per single-tech truck (Ruth King's hourly build-up)
- $492,230 at five times burdened cost, a stretch goal, not a gate
Trucks: the cost above includes a dedicated truck. We plan the Section 179 and bonus depreciation timing with you. Your CPA files the return.
See the numbers as a table
| Cost | A year | A month |
|---|---|---|
| Base pay | $74,240 | $6,187 |
| Social Security and Medicare | $5,679 | $473 |
| Federal unemployment | $42 | $4 |
| State unemployment | $140 | $12 |
| Workers' comp | $1,745 | $145 |
| Health insurance | $0 | $0 |
| Truck (lease, insurance, upkeep) | $12,600 | $1,050 |
| Software seat | $3,000 | $250 |
| Training | $1,000 | $83 |
| All in | $98,446 | $8,204 |
The rest of the picture
The numbers behind the numbers, and anything Frank is working on.
Data quality
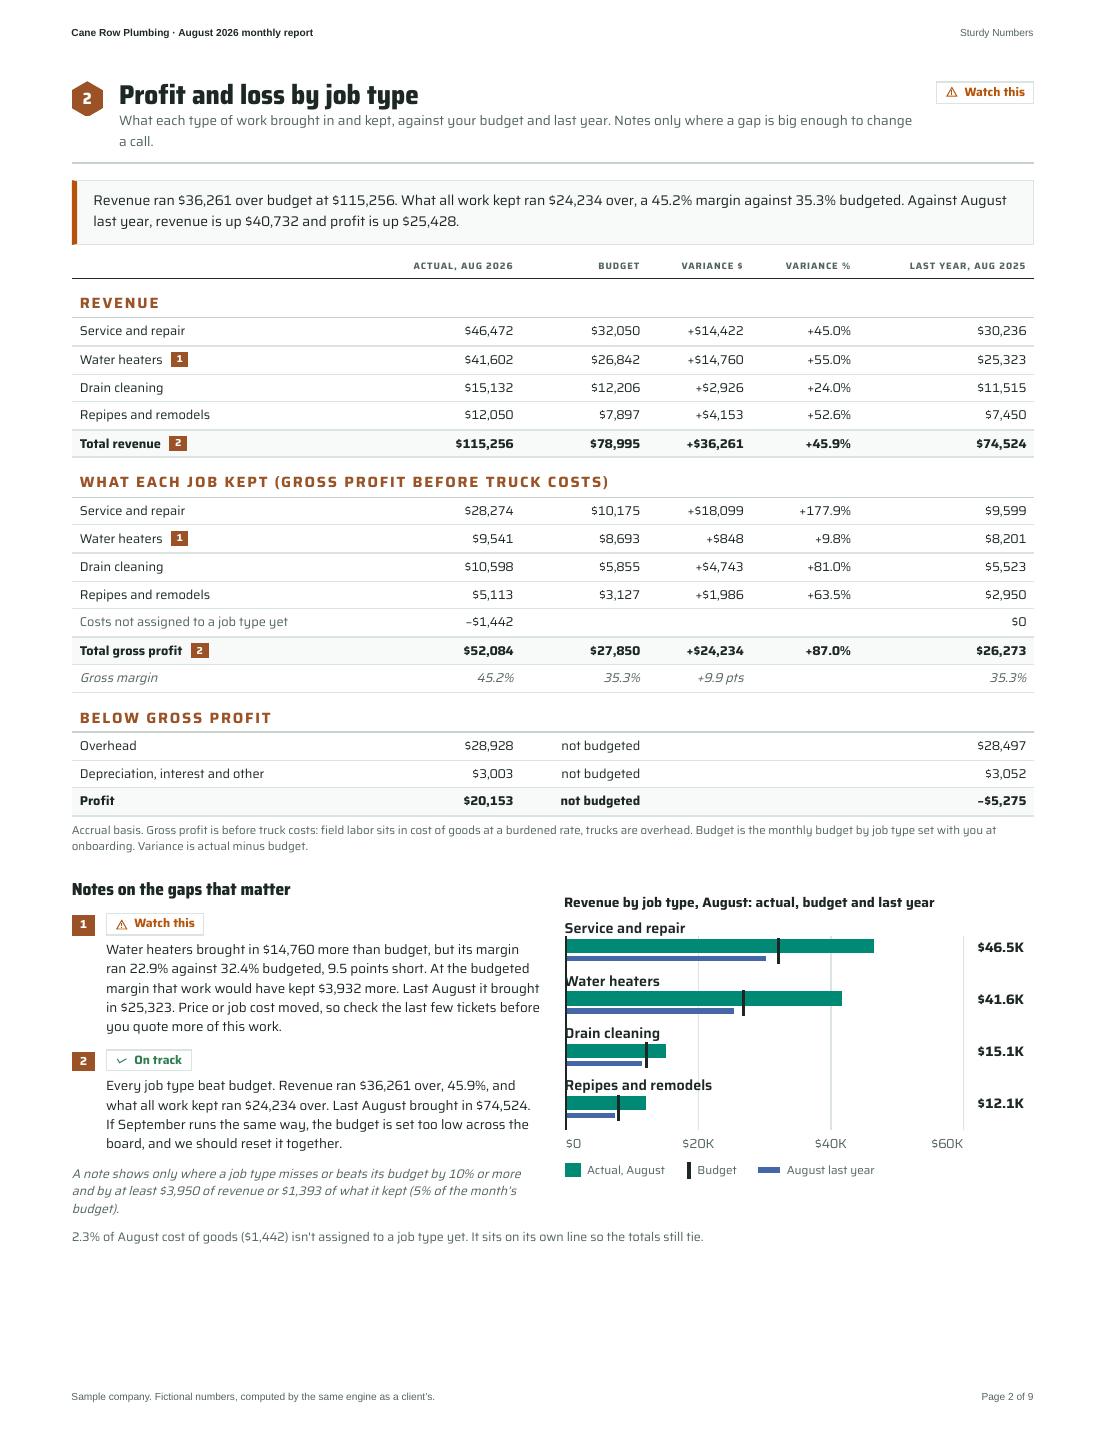
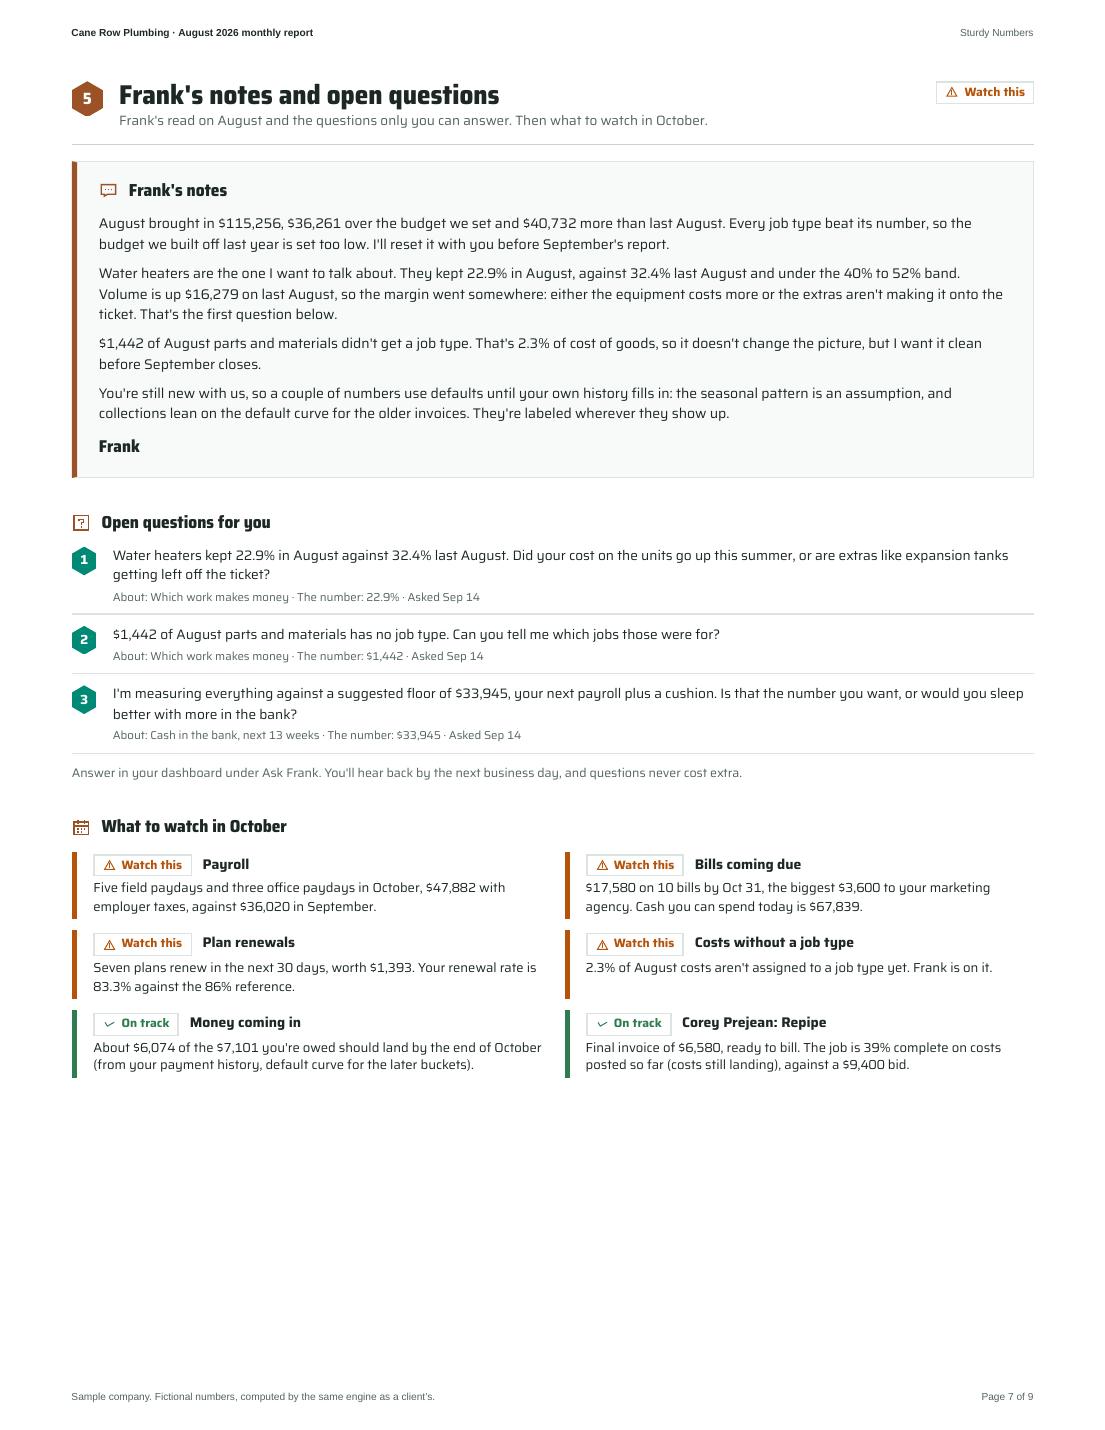
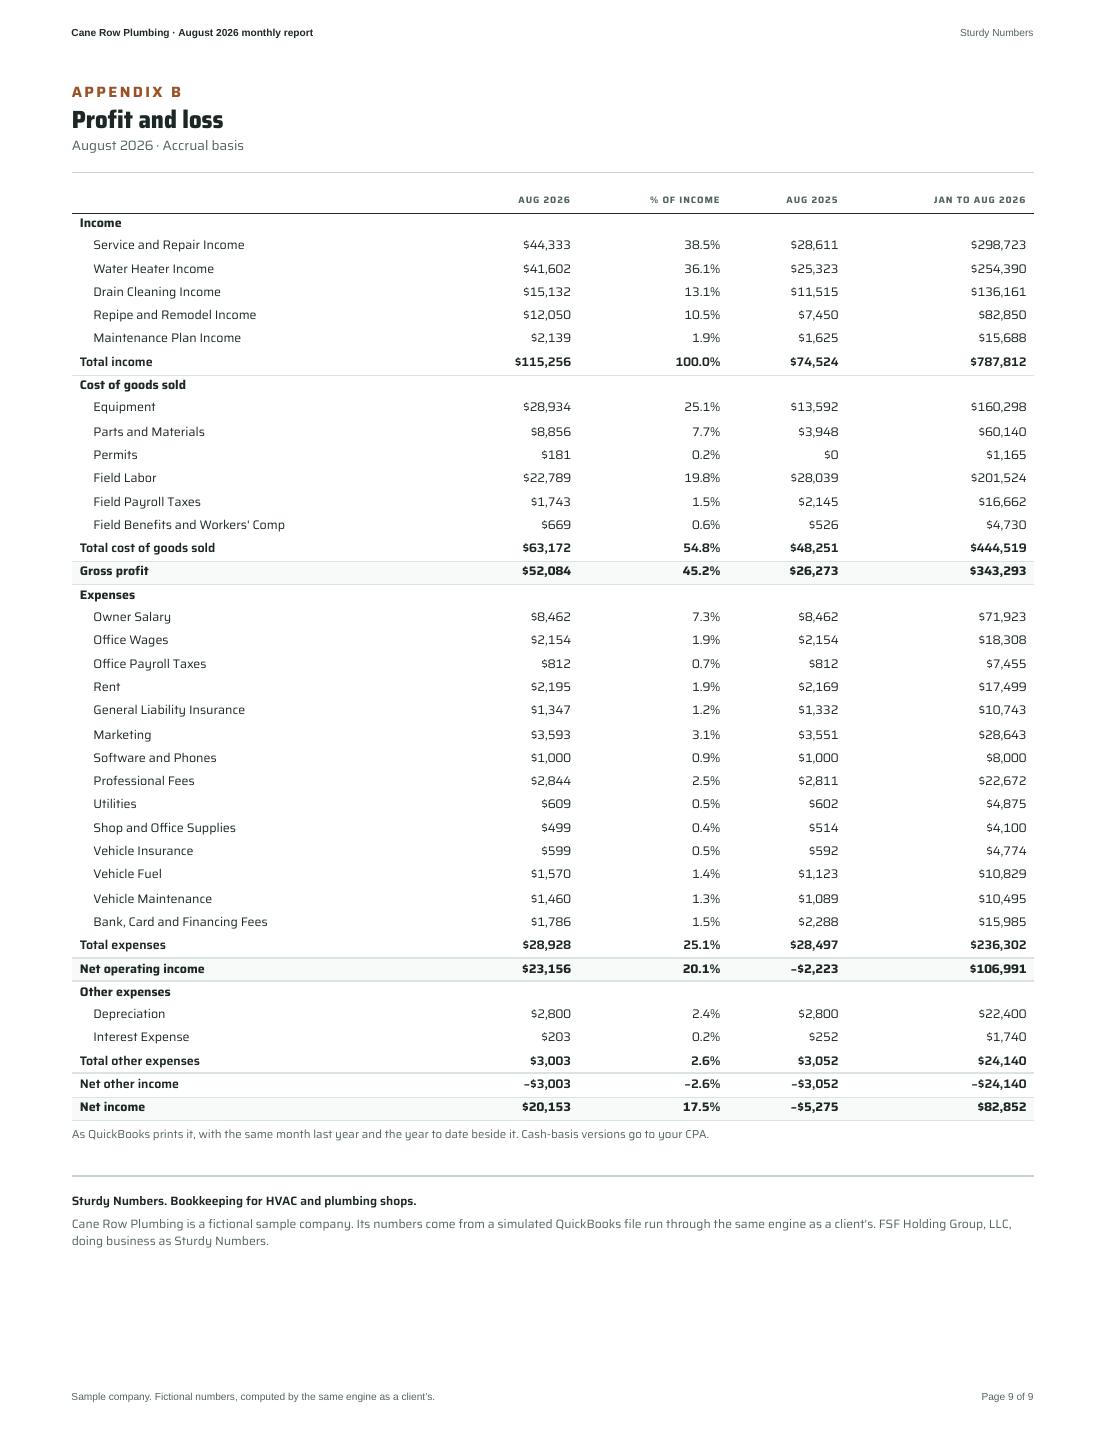
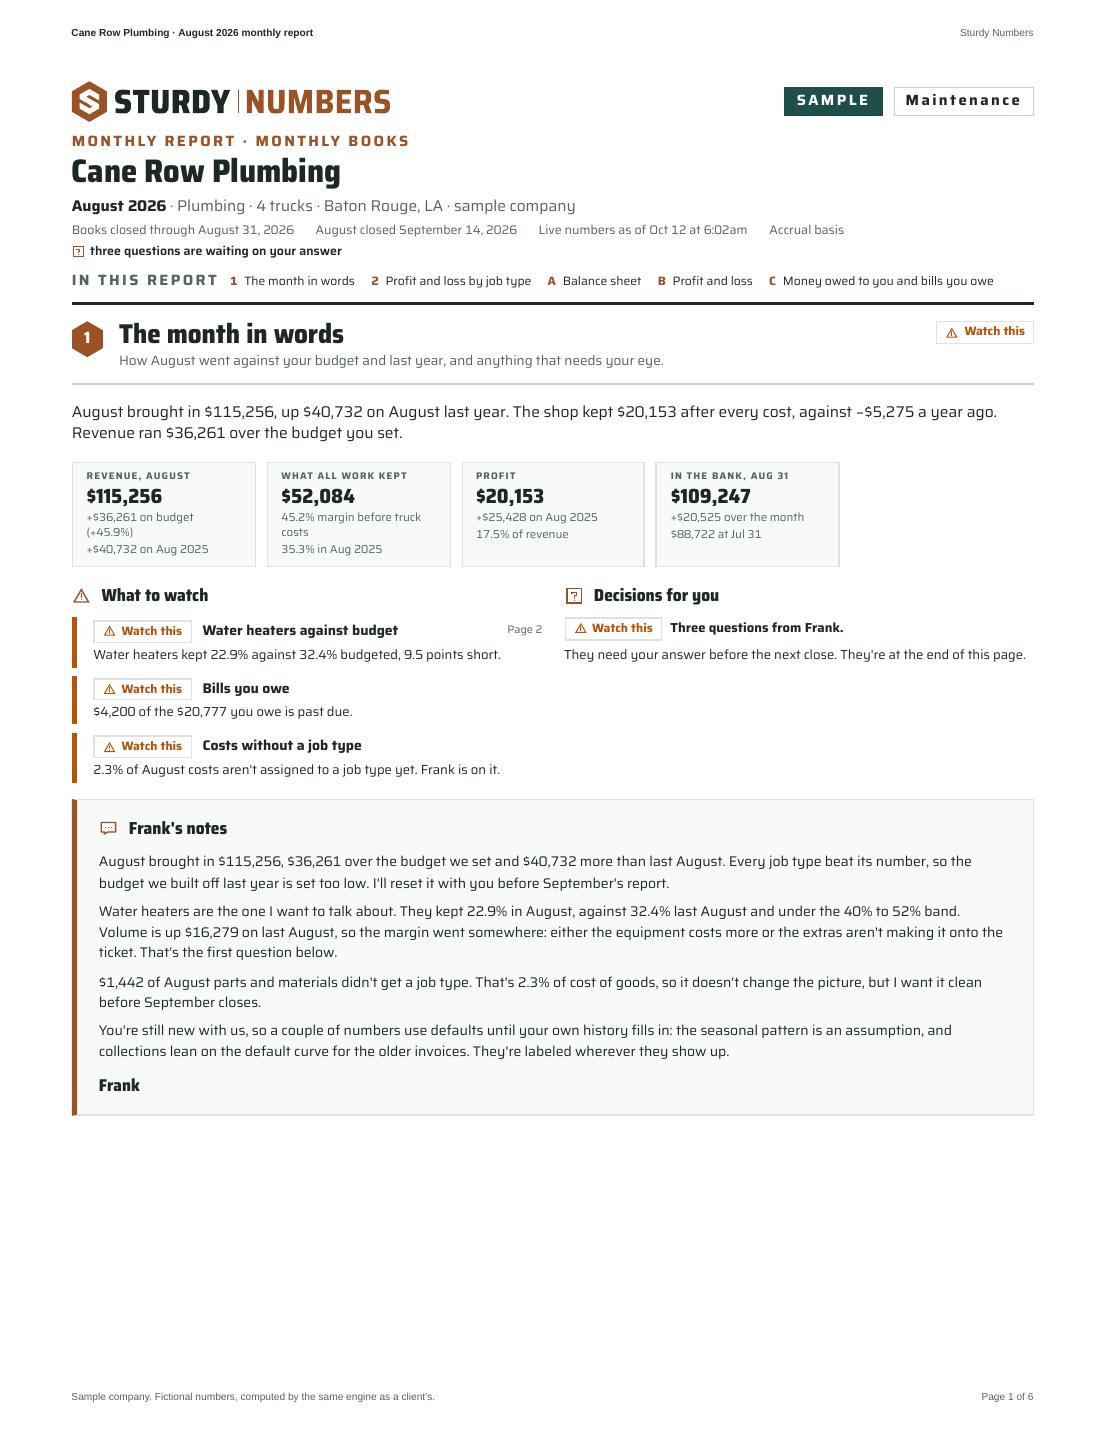
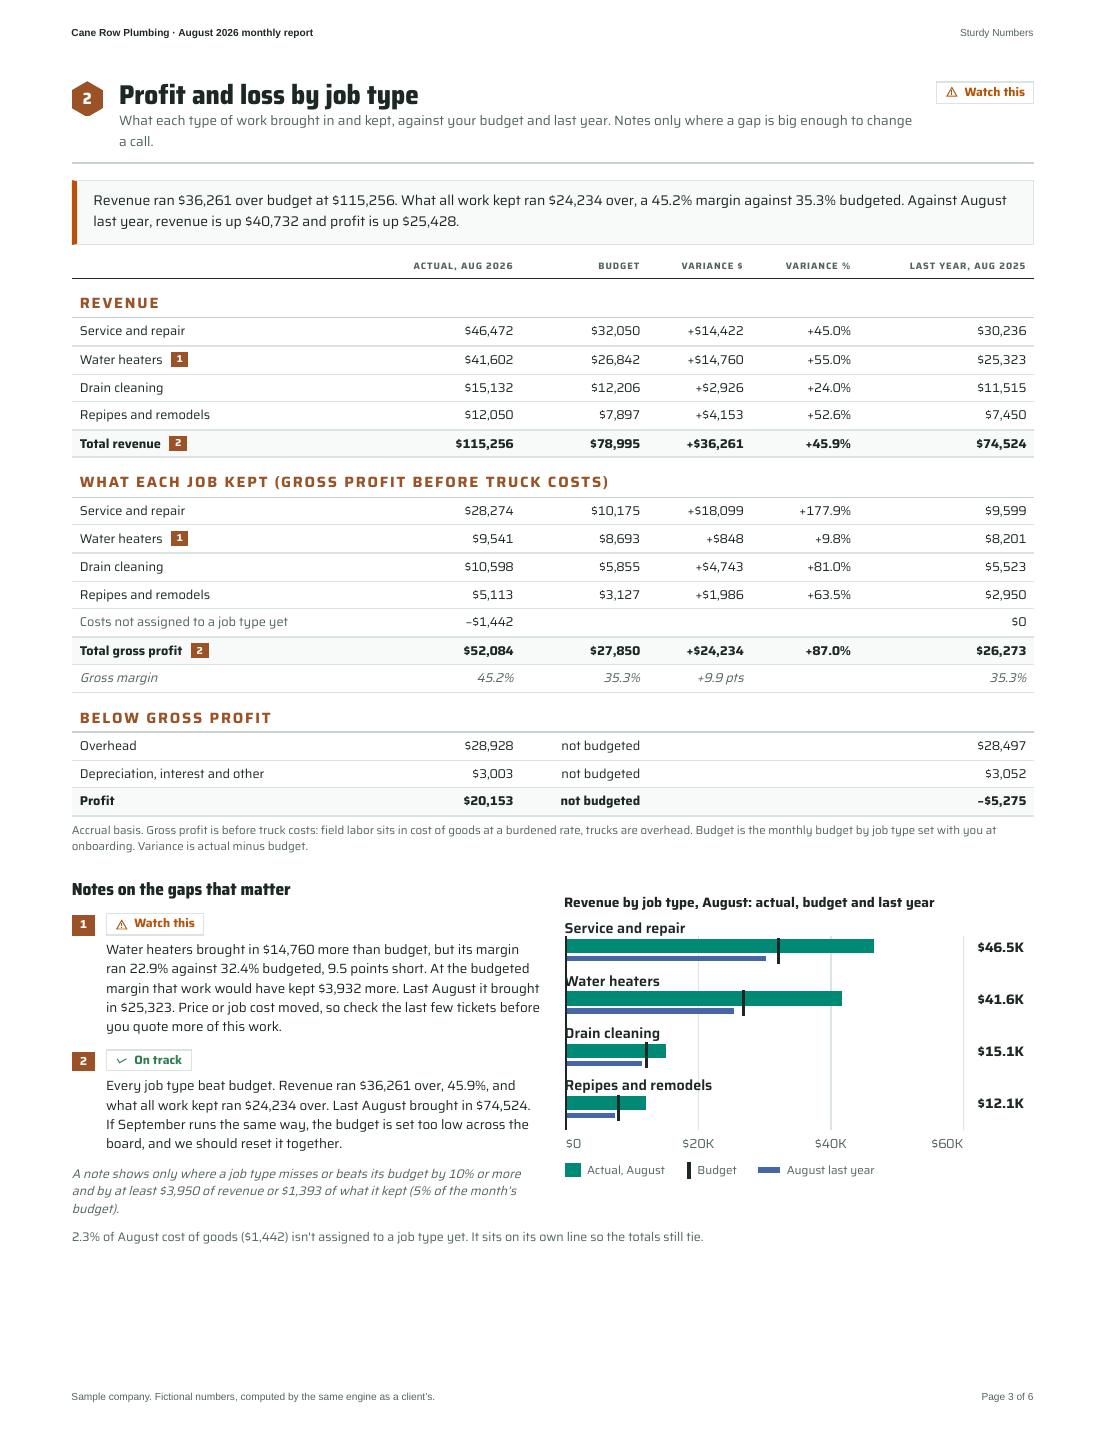
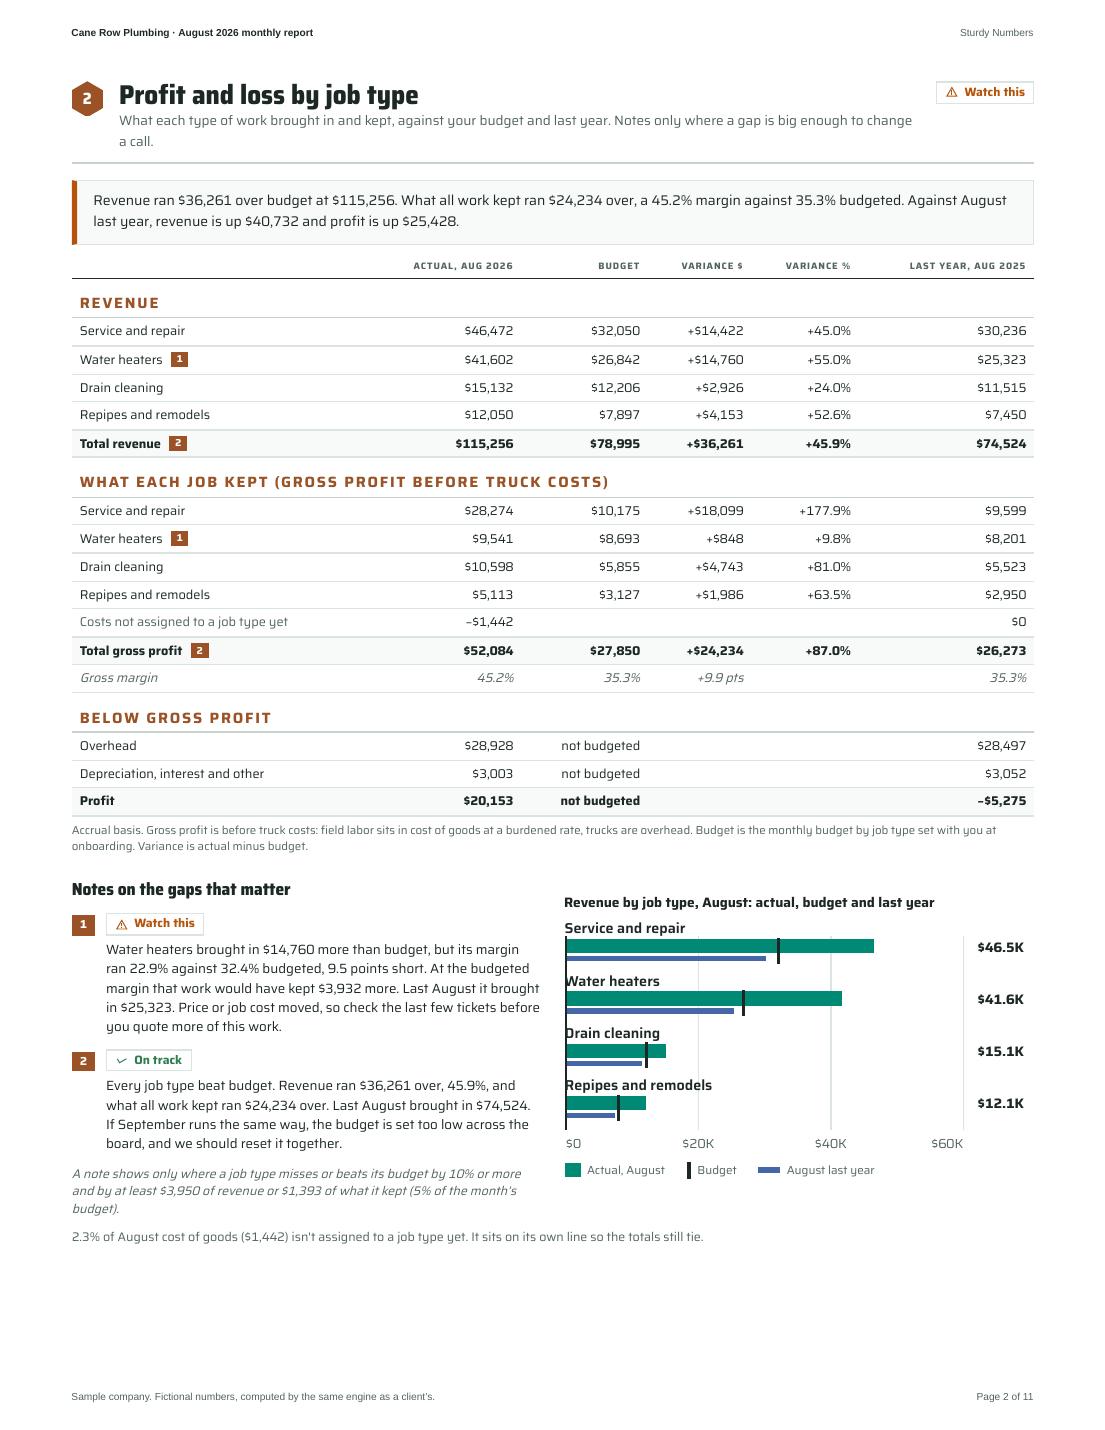
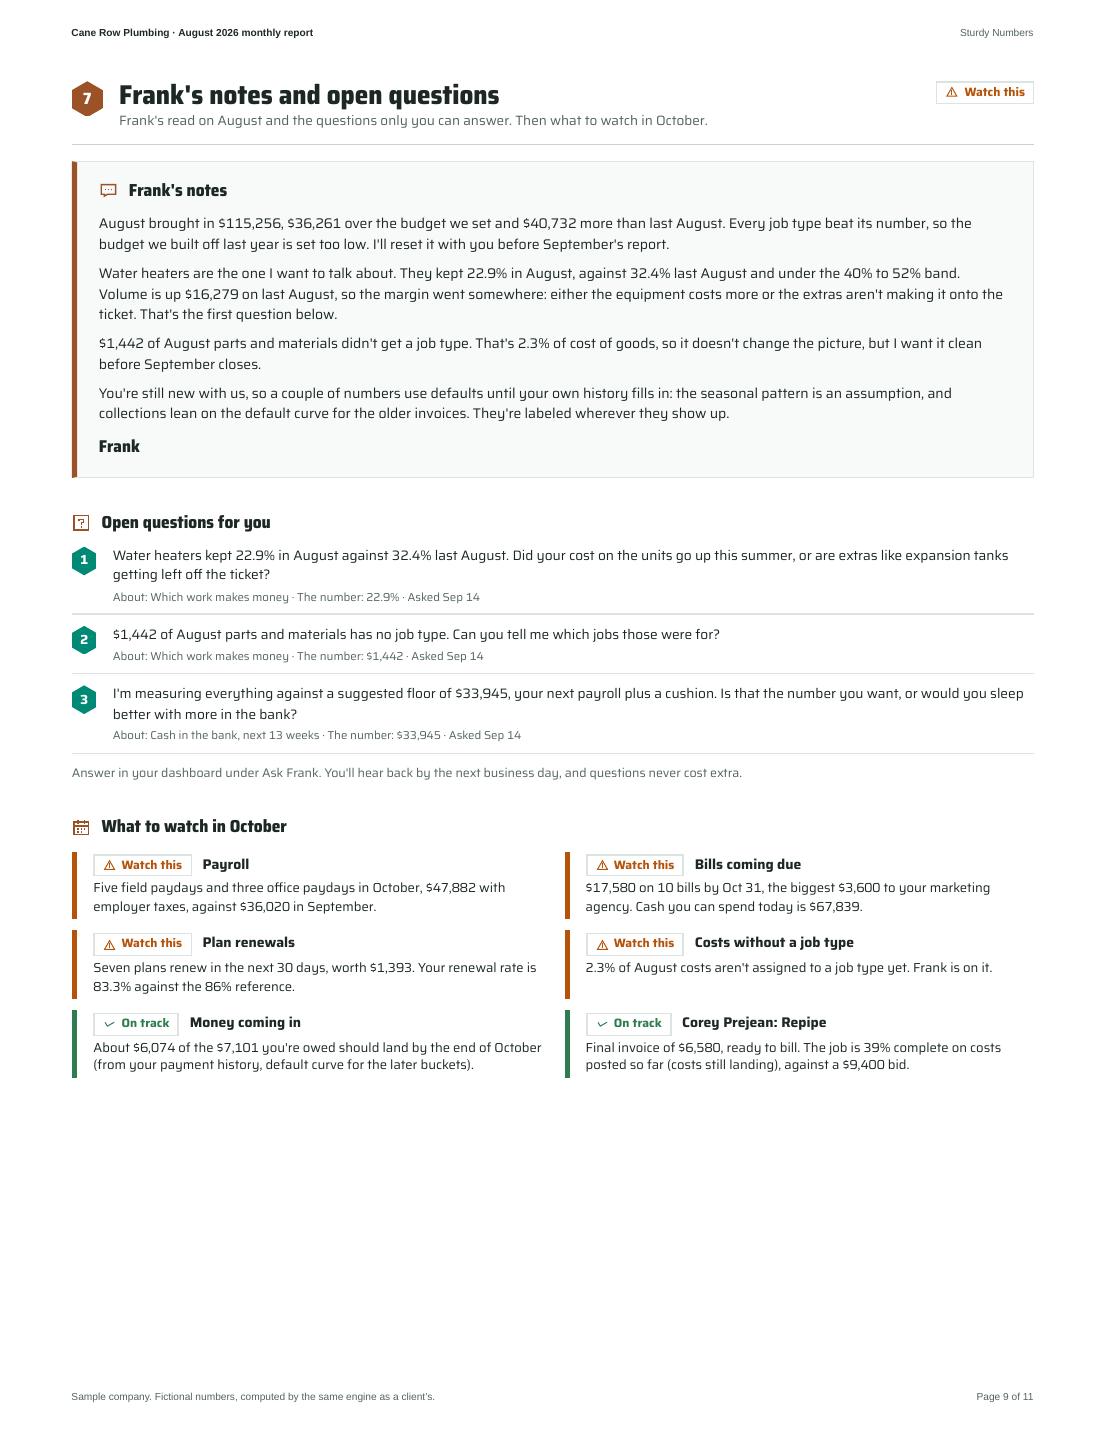
2.3% of August costs aren't assigned to a job type yet. Frank is on it.Watch this
2.3% of August costs aren't assigned to a job type yet. Frank is on it.Watch this
- 2.3% of August costs aren't assigned to a job type yet. Frank is on it.Watch this
- One open job is still collecting costs; labor posts at the monthly close.On track
- Field payroll is split by job type through the last close.On track
- Payments received but not yet deposited are shown apart from cash in the bank.On track
- Book and bank agree through the last statement.On track
- No late invoice has an unapplied payment sitting beside it.On track
- Owner draws sit in equity, not expenses.On track
Recurring base
Watch this129 customers are on a plan, 6.8% of your customers. Most shops sit under 15%. At 30% the base would bring in $113,430 a year.
Sources: Plan invoices in QuickBooks. Reference: Contracting Business, 2016; Margin One (best-in-class residential).
Revenue per tech and per truck
Watch thisEach of your four field people brought in $274,087 over the last 12 months, under the well-run band. Each truck carries $18,989 a year of overhead.
Sources: Steph's Books plumbing margins. Per truck: ShareWillow (observations from 200-plus shops); Leach, ACHR News 2013 ($200K per service truck).
Open jobs
On trackCorey PrejeanRepipe · Repipes and remodels · bid $9,400costs still landing
Complete39%Spent vs budget$2.4K of $6.0KProjected margin36.0%bid 36.0%Next invoiceFinal · $6,580Ready to bill
Tap to close. Cost groups and every line behind this card sit in the monthly report.
Spent against budget is cost to date over the job budget. Labor posts at the monthly close.
Bills you owe
Watch thisdue Oct 10$3,600
due Oct 29$3,256
due Oct 22$2,061
due Oct 13$1,998
due Nov 3$1,787
See the numbers as a table
| Age | Bills | Amount |
|---|---|---|
| Current | 10 | $16,578 |
| 1 to 30 days late | 2 | $4,200 |
| 31 to 60 days late | 0 | $0 |
| 61 to 90 days late | 0 | $0 |
| Over 90 days late | 0 | $0 |
| Total | 12 | $20,777 |
From your job software
Not connectedAsk Frank about a number
Pick the number, ask in your own words. You get a reply by the next business day, and questions never cost extra.
This is a sample shop, so questions here go nowhere. Want this built on your own numbers? Book a call with Frank.